Figures & data
Figure 1. Weaving segment configuration (a) Type A, (b) Type B, and (c) Type C (source: Highway Capacity Manual [HCM 2000; Transportation Research Board, Citation2000]).
![Figure 1. Weaving segment configuration (a) Type A, (b) Type B, and (c) Type C (source: Highway Capacity Manual [HCM 2000; Transportation Research Board, Citation2000]).](/cms/asset/d608dd78-62ca-4c80-89e2-af5ed8210a3c/uawm_a_1350213_f0001_b.gif)
Table 1. Specification of the weaving segments and basic segment on the test route.
Table 2. Traffic conditions in groups.
Figure 2. Observed interior noise levels on segments.
Figure 3. (a) Probability distribution of daily interior noise exposure level. (b) Daily interior noise exposure levels on segments.
Figure 4. (a) Average hazard equivalent exposure time factors (EETFs). (b) Total EETFs under different traffic conditions.
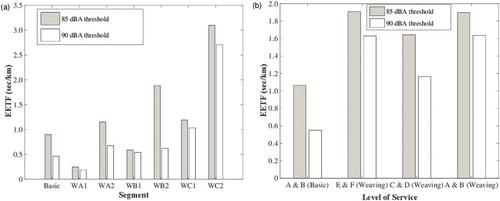
Figure 5. (a) Hazard quotient values for the threshold 85 dB(A) on segments. (b) Hazard quotient values for the threshold 90 dB(A) on segments.
Figure 6. Importance of the 11 predictor variables for the bagged decision tree–based in-vehicle noise model.
Figure 7. Out-of-bag regression error for 300 deep grown trees.
Table 3. Text description of the first 10 splits in decision tree for regression.
Figure 8. Fitted regression lines for (a) training data set and (b) validation data set.