
Figures & data
Table 1. Metrics used for performance evaluation (Boylan and Russell Citation2006; Chen et al. Citation2008).
Figure 1. Emissions of PM2.5 from wildfires and prescribed burns for 2011 based on NEI-2011. For each month, the stacked bar on the left is for wildfire and the bar on the right is for prescribed fire.
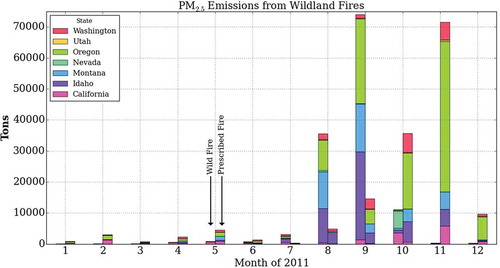
Table 2. Performance metrics for PM2.5 at the AQS and IMPROVE sites.
Figure 2. Modeled to observed ratio versus observed PM2.5 concentrations for AQS and IMPROVE sites.
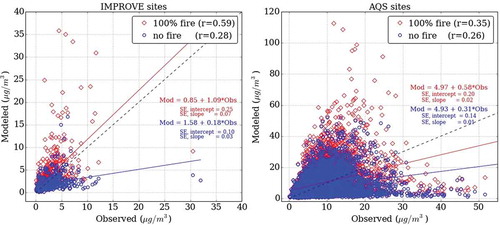
Figure 3. Bugle plots for comparison of MFB and MFE with goals and criteria for PM2.5 during the period of simulation.
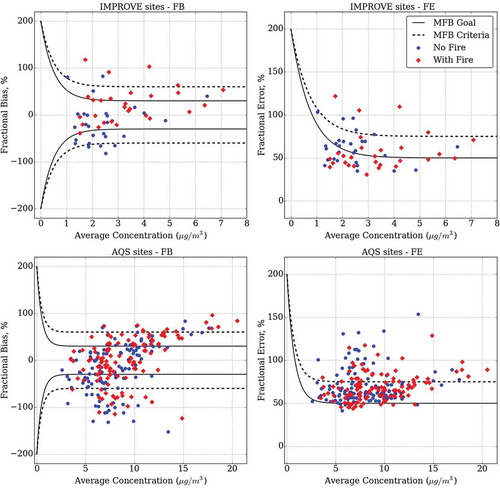
Table 3. Performance metrics at the IMPROVE sites.
Figure 4. Modeled and observed deciview comparison for all days and 20% worst visibility days within the simulation period.
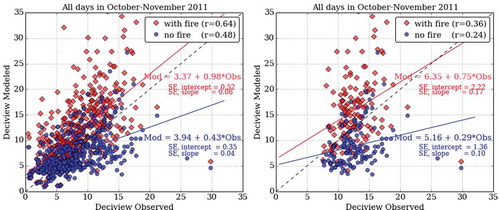
Figure 5. (a) PM2.5 difference between the 100% fire case and the no fire case when averaged over all days in the simulation period. (b) Percent change in PM2.5 concentrations when all the fire emissions are uniformly reduced by 70%. Results for only those model grid cells where PM2.5 concentrations for 100% fire case is greater than 12 μg/m3 are shown.
Figure 6. PM2.5 distributions at selected sites for the three different scenarios. Whiskers represent 2nd and 98th percentiles.
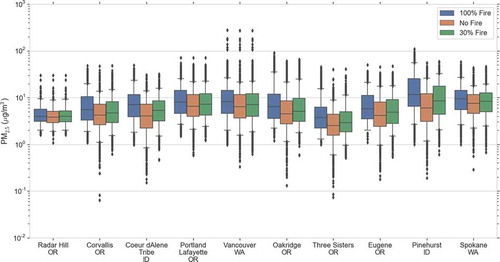
Table 4. Impact estimates for various health endpoints for no fire and 30% fire case (control cases) with 100% fire case (base case).
Figure 7. Prescribed fire attributed additional asthma attacks and mortality cases for various states in AIRPACT-4 model domain.
Figure 8. Deciview distribution for the grid cells in class I areas for the three emission scenarios.
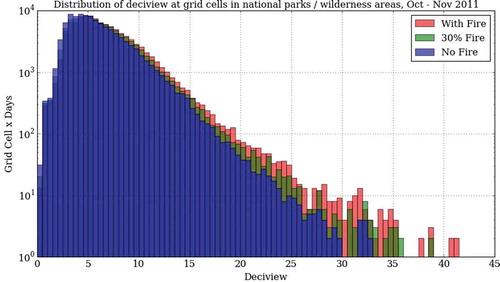
Table 5. Changes in average deciviews for the haziest 20% days during October–November 2011 at IMPROVE sites. Sites where the deciview improvements for the recued fire case are comparable with the Theil trend are shown in bold.