
Figures & data
Table 1. The experimental design.
Figure 1. Effects of salt (S) and salt + SNP treatment (T) on plant height (HT), fresh weight (FW) and dry weight (DW) in two wild barley cultivars.
The gray bars indicate Saertu wild barley variety, and the white bars indicate the wild-type barley variety. Bars showed as mean values ± SD (n = 3). CK, non-treated control; T1–T5, see . Same lowercase letters indicate non-significant differences.
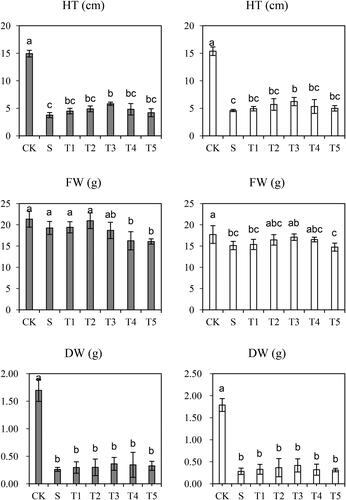
Table 2. Effects of salt stress and NO on photosynthetic pigment content in both cultivars according to split-plot analysis of variance.
Figure 2. Effects of salt (S) and Salt + SNP treatment (T) on Malondialdehyde (MDA) Concentration in two wild barley cultivars.
The gray bars indicate Saertu wild barley variety, and the white bars indicate the wild-type barley variety. Bars showed as mean values ± SD (n = 3). CK, non-treated control; T1–T5, see . Same lowercase letters indicate non-significant differences.
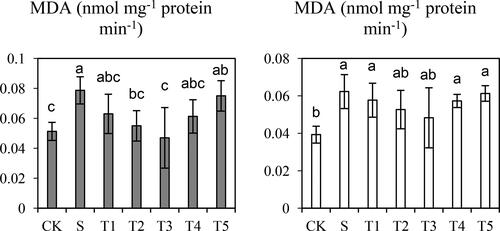
Figure 3. Effects of salt (S) and Salt + SNP treatment (T) on SOD, APX, POD and CAT in two wild barley cultivars.
The gray bars indicate Saertu wild barley variety, and the white bars indicate the wild-type barley variety. Bars showed as mean values ± SD (n = 3). CK, non-treated control; T1–T5, see . Same lowercase letters indicate non-significant differences.
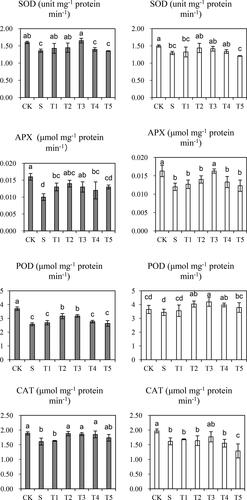
Figure 4. Effects of Salt (S) and Salt + SNP treatment (T) on water-soluble carbohydrate (WSC) and Protein Content in two wild barley cultivars.
The gray bars indicate Saertu wild barley variety, and the white bars indicate the wild-type barley variety. Bars showed as mean values ± SD (n = 3). CK, non-treated control; T1–T5, see . Same lowercase letters indicate non-significant differences.
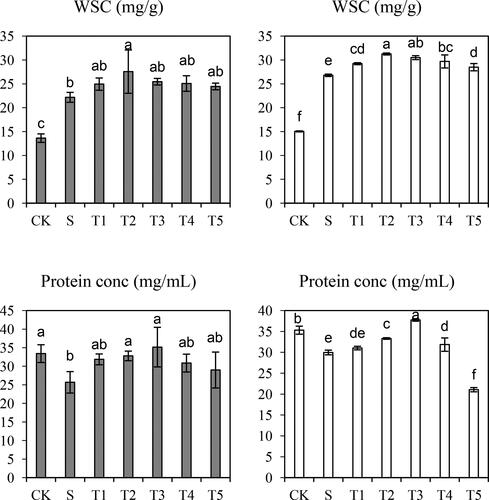
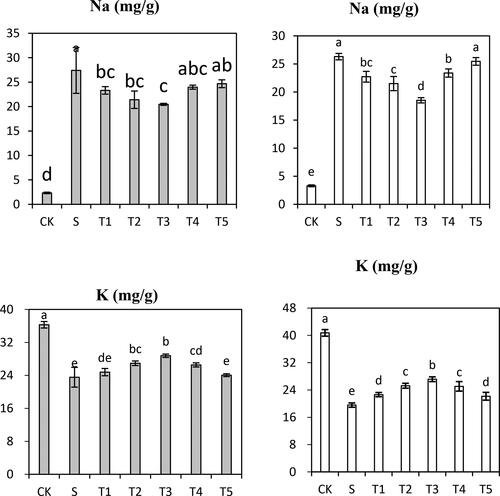
Figure 5. Effects of Salt (S) and Salt + SNP treatment (T) on Na+ and K+ Content in in two wild barley cultivars.
The gray bars indicate Saertu wild barley variety, and the white bars indicate the wild-type barley variety. Bars showed as mean values ± SD (n = 3). CK, non-treated control; T1–T5, see . Same lowercase letters indicate non-significant differences.
Data availability
The data that support the findings reported in this study are available from the corresponding author upon reasonable request.