Figures & data
Figure 1. Steps of data retrieval.
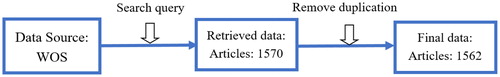
Figure 2. The annual number of published articles of OWP in WOS Core. Source: Gao et al. (2016).
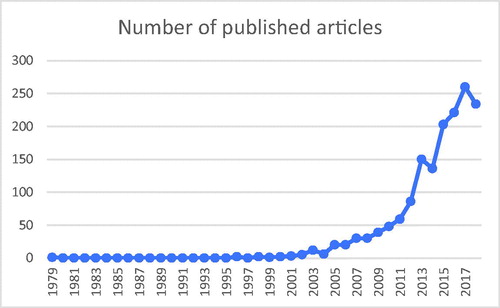
Figure 3. The new installations and the total installations of offshore wind power in the globe.
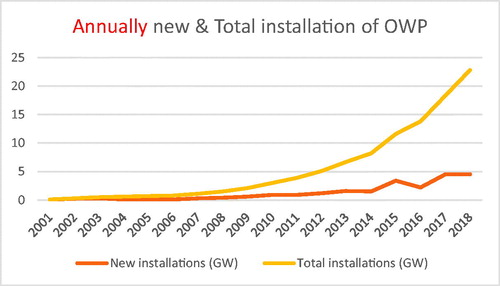
Figure 4. The Fitting curve of the annually new published articles and the annually new installation of OWP.
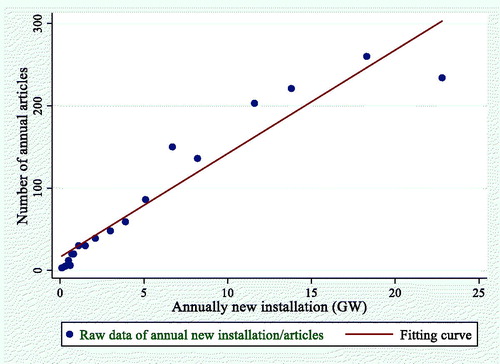
Table 1. Estimation results of the annual installation on the number of articles.
Figure 5. Steps of visualized analysis.
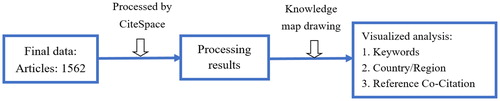
Figure 6. Keyword knowledge mapping of OWP.
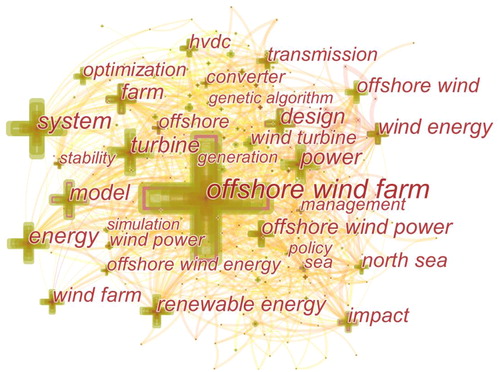
Table 2. High-frequency keywords (≥100).
Figure 7. Country/region knowledge mapping of OWP.
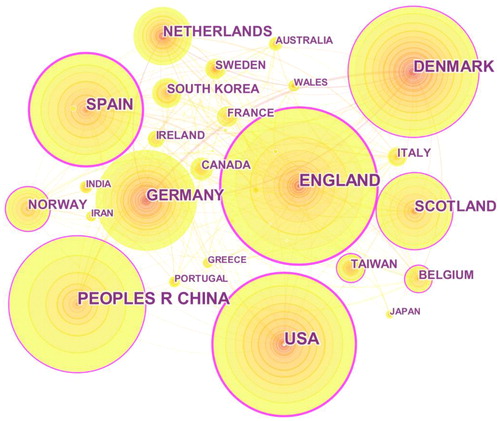
Table 3. The most productive 20 countries/regions in OWP research until 2018.
Figure 8. Co-citation knowledge mapping of OWP.
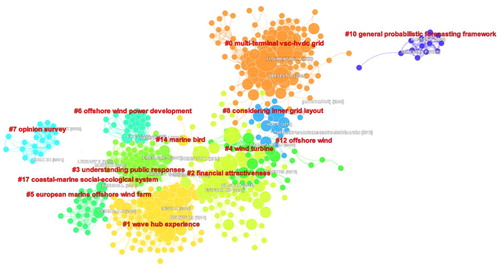
Table 4. Clusters which reflect the 13 themes of OWP.
Table 5. Top 20 references with the strongest citation bursts.
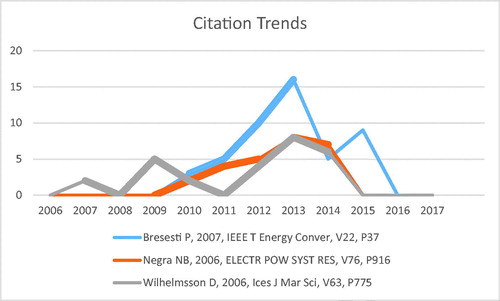
Figure 9. Citation trends and burst duration of the mentioned 3 articles.