Figures & data
Figure 1. The number of publications and citations per year in financial systemic risk research.
Source: Author.
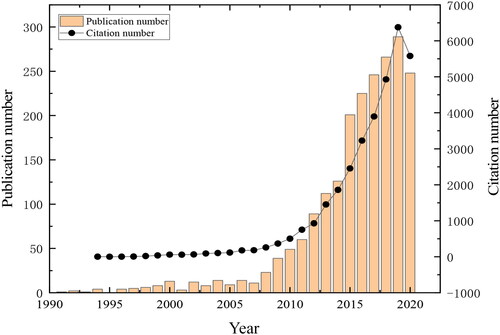
Figure 2. The document type of the financial systemic risk research.
Source: Author.
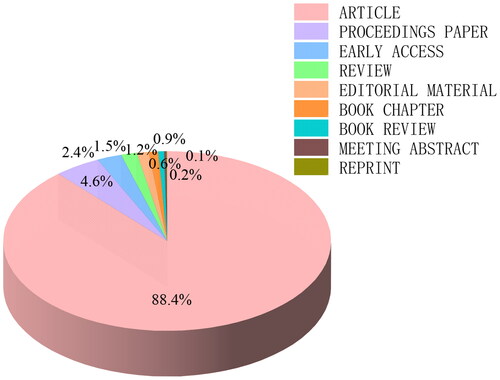
Table 1. The top 10 subject categories in the financial systemic risk research.
Figure 3. Cluster network in the financial systemic risk research.
Source: Generated using CiteSpace on data.
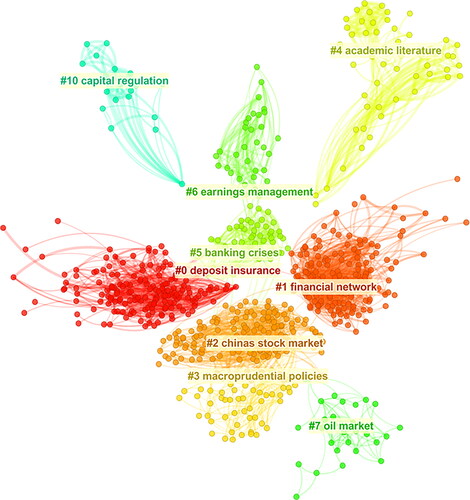
Table 2. Summary of the largest 6 clusters.
Table 3. Top 10 most cited articles with co-citation frequency.
Figure 4. Double figures overlay in the financial systemic risk research.
Source: Generated using CiteSpace on data.
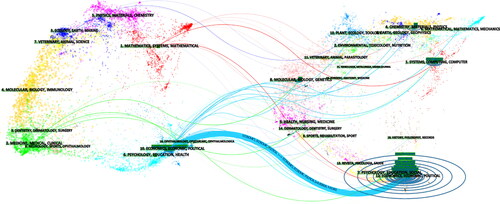
Figure 5. A visualisation of the country’s collaboration network.
Source: Generated using CiteSpace on data.
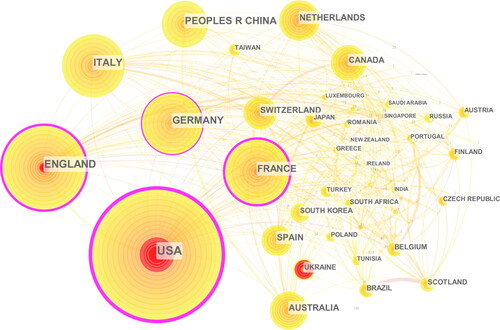
Table 4. Top 15 productive countries in financial systemic risk research.
Table 5. Top 15 productive and influential institutions in the financial systemic risk research.
Figure 6. A visualisation of the institution’s collaboration network.
Source: Generated using CiteSpace on data.
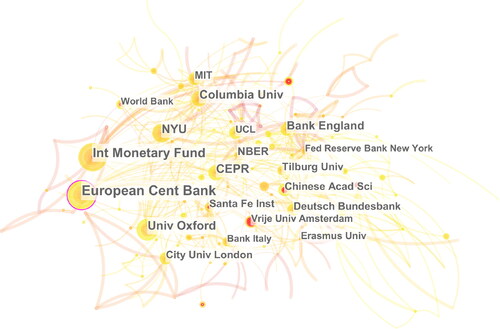
Table 6. Top 15 productive journals in financial systemic risk research.
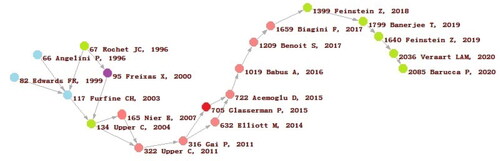
Figure 7. A visualisation of the author’s collaboration network.
Source: Generated using CiteSpace on data.
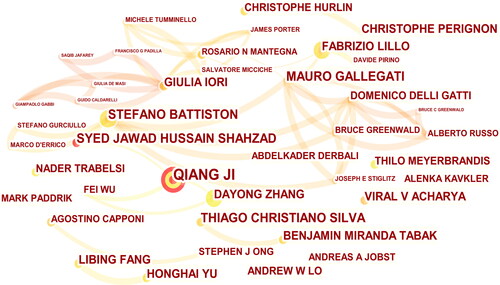
Table 7. Top 15 productive authors in the financial systemic risk research.
Table 8. Top 10 references with the strongest citation bursts.
Figure 8. The time zone view of keywords between 1990 and 2020.
Source: Generated using CiteSpace on data.
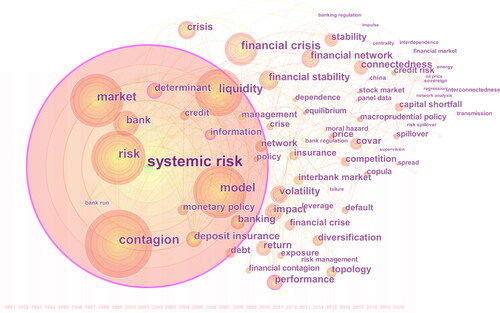
Table 9. Top 10 keywords with the strongest citation bursts.
Figure 9. The local forward main path in the financial systemic risk research.
Source: Generated using Pajek on data.
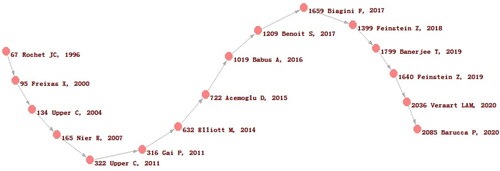
Figure 10. The local backward main path in the financial systemic risk research.
Source: Generated using Pajek on data.
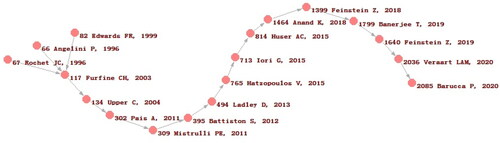
Figure 11. The global standard main path in financial systemic risk research.
Source: Generated using Pajek on data.
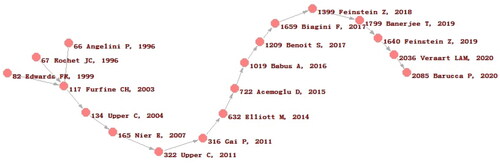
Figure 12. The global key-route main path in financial systemic risk research.
Source: Generated using Pajek on data.