
Figures & data
Figure 1. Graphic representation of participants’ distribution according to their school grade.
Source: The authors.
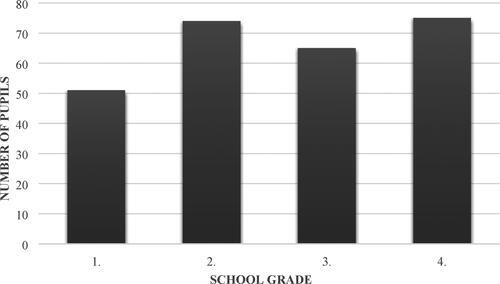
Table 1. Body height, body mass and body mass index for boys.
Table 2. Body height, body mass and body mass index for girls.
Figure 2. Boys’ body mass index (BMI) representation according to school grade.
Source: The authors.
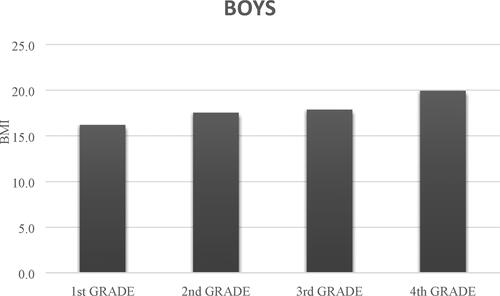
Table 3. Body mass index (BMI) representation for 1st to 4th grade boys.
Figure 3. Girls’ body mass index (BMI) representation according to school grade.
Source: The authors.
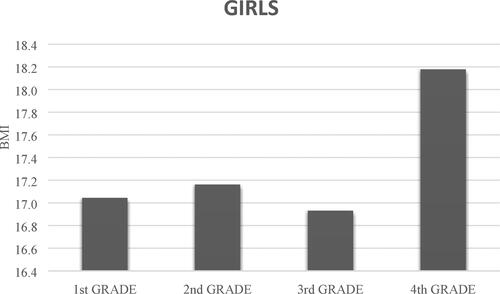
Table 4. Body mass index (BMI) representation for 1st to 4th grade girls.
Figure 4. Practising sports in their free time among boys.
Source: The authors.
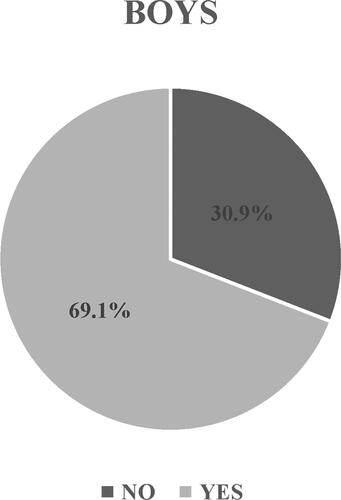
Figure 5. Practising sports in their free time among girls.
Source: The authors.
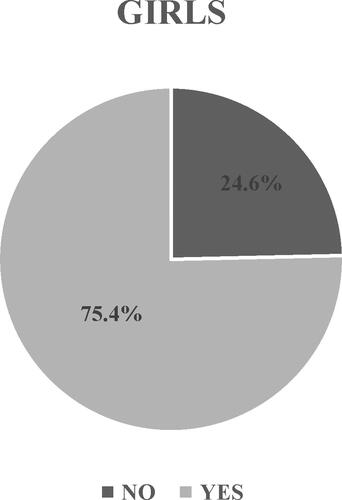
Figure 6. Frequency of trainings per week among boys.
Source: The authors.
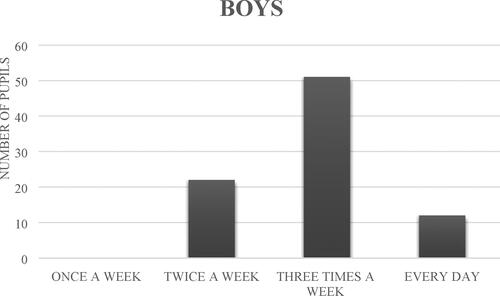
Table 5. Training duration in minutes among boys.
Figure 7. Frequency of trainings per week among girls.
Source: The authors.
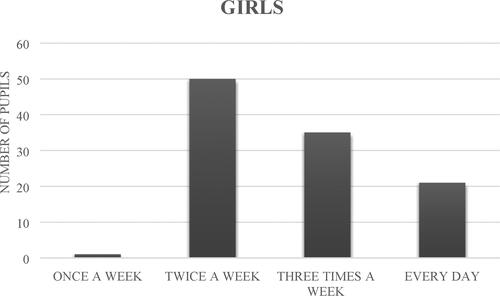
Table 6. Training duration in minutes among girls.
Figure 8. Time spent outdoors by boys.
Source: The authors.
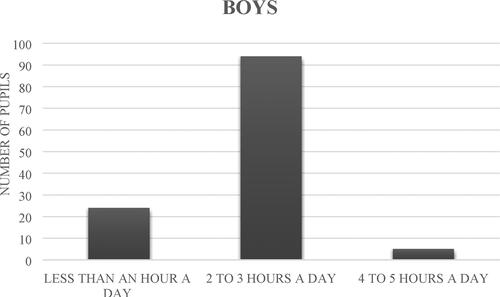
Figure 9. Time spent outdoors by girls.
Source: The authors.
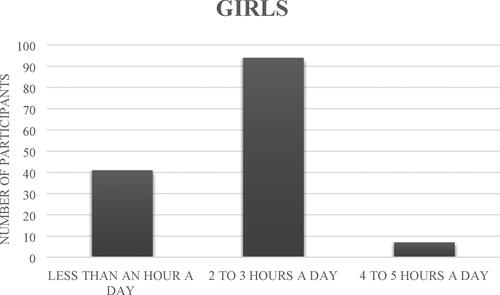
Table 7. Difference in the analysed variables between girls and boys.