Figures & data
Table 1. Influence of hypoxia stress on temperature, pH, EC, and DO of the nutrient solution during the experiment
Table 2. Influence of hypoxia stress on leaf water potential (ψL), N, K, and Na contents in four millet species
Figure 1. Plant growth rate (PGR), shoot growth rate (GRs) and root growth rate (GRr) among four millet species 28 days after the hypoxic treatment. C, Control; H, Hypoxia; SSI, Stress susceptible index. The treatment means were compared using the t-test (p < 0.05). ** and * indicate significant differences at p < 0.01 and p < 0.05, NS indicates not significant. Means with the same letter are not significantly different according to Tukey’s HSD (p < 0.05) when comparing the four species. n = 6.
Figure 2. Length of adventitious root and location of root hair (A) and cross section of adventitious root 2 cm from the root tip (B) among four millet species 18 days after the hypoxic treatment. C, Control; H, Hypoxia. Location of the root hair was deducted from pictures in . 0.0 means base of root in (A). The treatment means were compared using the t-test (p < 0.05). ** and * indicate significant differences at p < 0.01 and p < 0.05, NS indicates not significant. n = 6. Cell wall was stained with 0.1% toluidine blue. Arrowheads show root hair. Scale bars = 500 μm.
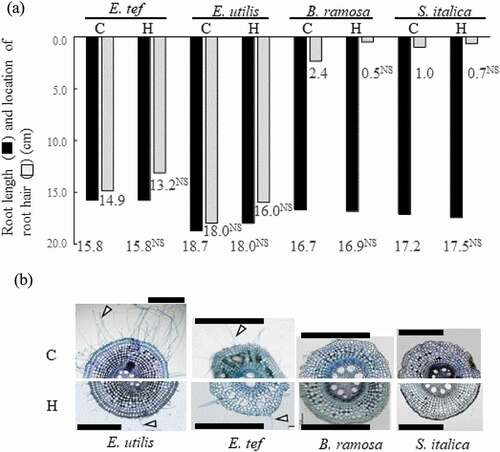
Figure 3. Transverse cross section of each position of adventitious roots in control and hypoxic treatments 18 days after the treatment. C, Control; H; Hypoxia. Base: Observation 1 cm from the junction of shoot and adventitious root. Cell wall stained with 0.01% toluidine blue. Arrowheads show lysigenous aerenchyma. Scale bar = 500 μm.
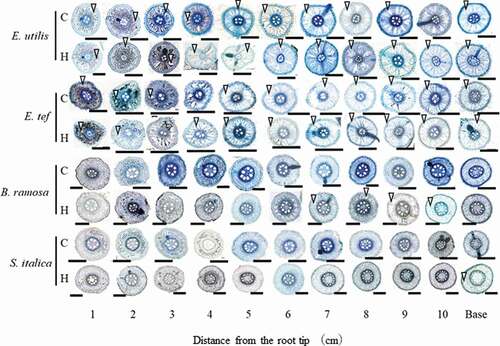
Figure 4. Percentage of stele (A) and lysigenous aerenchyma area (B) in cross-sections of adventitious roots (14–19 cm long) 18 days after the treatment. C, Control; H, Hypoxia. Base: Observation 1 cm from the junction of shoot and adventitious root. Data are presented as the mean (n = 6). Means with the same letter are not significantly different according to Tukey’s HSD (p < 0.05) at each distance from the root tip when comparing the four species.
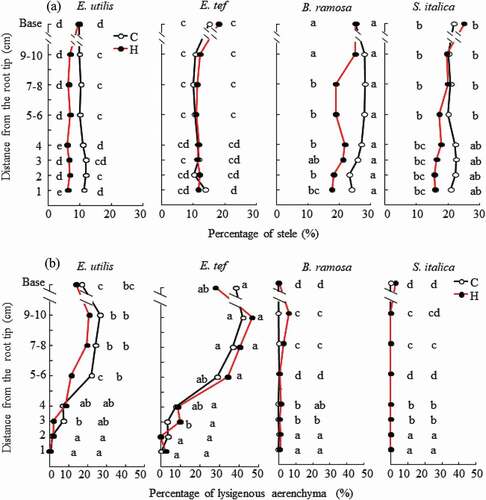
Figure 5. Lignin accumulation in sclerenchyma of adventitious roots grown in aerated control (C) and hypoxic treatment (H) by flushing N2. Base: Observation 1 cm from the junction of shoot and adventitious root. Cross section of 14–19 cm adventitious roots 18 days after the treatment, stained with phloroglucinol-HCl and viewed under white light. Arrowheads show lignin (stained red) accumulation. Scale bar = 50 μm.
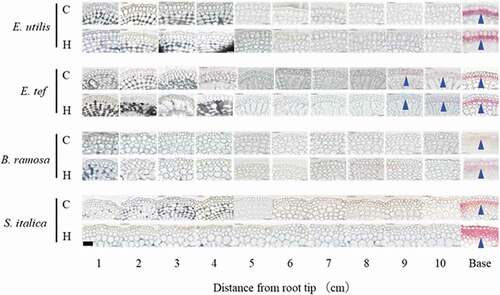
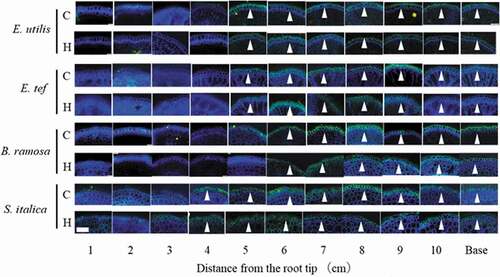
Figure 6. Suberin accumulation in hypodermis/exodermis of adventitious roots grown in aerated control (C) and hypoxic treatment (H) by flushing N2. Base: Observation 1 cm from the junction of shoot and adventitious root. Cross section of 14–19 cm adventitious roots 18 days after the treatment, stained with Fluorol yellow 088 and observed under UV illumination. Arrowheads show suberin accumulation (stained yellow-green). Scale bar = 100 μm.