
Figures & data
Figure 1. Immunostaining of apolipoprotein E, caspase 3, complement 3 and 9 in relation to amyloid (study cohort). (A–H) Comparison between immunohistochemistry and the enrichment of investigated proteins using the example of renal ALκ amyloidosis. Serial sections: hematoxylin eosin staining (A), Congo red staining in bright light (B), immunostaining with antibodies directed against κ-light chain (C), Congo red staining in fluorescence light (D; same section as in B), immunostaining with antibodies directed against apolipoprotein E (E), complement 9 (F), caspase 3 (G) and complement 3 (H); (I) caspase 3 immunoreactive cardiomyocytes (arrows) within amyloid deposits (asterisk). (J) Complement 9 immunoreactive cardiomyocytes (arrow head) surrounded by complement 9 immunoreactive amyloid deposits. Hematoxylin counterstain.
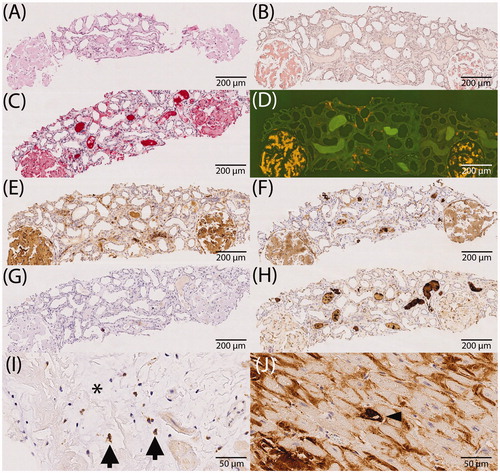
Table 1. Presence of positivity of the respective protein within amyloid deposits differentiated by amyloid type.
Table 2. Presence of positivity of the respective protein within amyloid deposits differentiated by organ-/tissue type.
Figure 2. Accordance by type of amyloidosis. The proportion of immunostained area of complement 9, apolipoprotein E, caspase 3 and complement 3 in relation to the entire amyloid deposits (i.e. 100%). Presentation according to the amyloid type. Each bar corresponds to one case.
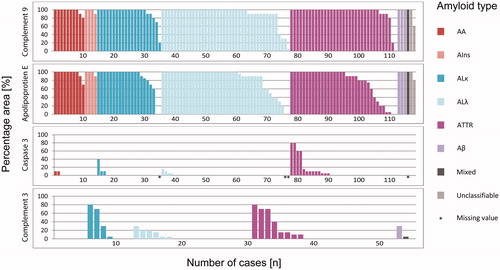
Figure 3. Accordance by histoanatomical localization. The proportion of immunostained area of complement 9, apolipoprotein E, caspase 3 and complement 3 in relation to the entire amyloid deposits (i.e. 100%). Presentation according to the organ-/tissue-type. Each bar corresponds to one case.
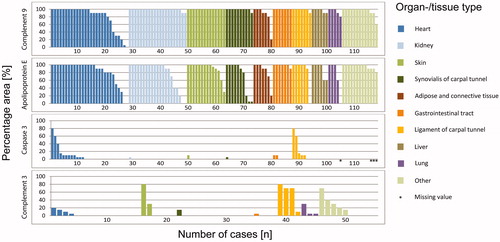
Table 3. Prevalence of caspase 3-/complement 9 single positive cells differentiated by organ-/tissue type.
Table 4. Prevalence of caspase 3-/complement 9 single positive cells differentiated by amyloid type.
Figure 4. Proteomics data obtained by literature search. Occurrences of apolipoprotein E (A), complement 9 (B) and complement 3 (C) in amyloid tissue sections are depicted for amyloid and organ type. Proteomic data were reviewed and extracted from amyloidosis cases analyzed by LMD LC–MS/MS (method described in [Citation9–11]). The total number of patients tested is indicated by data point area. Positive cases are colored/grey scaled depending on the number of spectras’ median measured, whereas negative cases are depicted by black areas. The number of spectra refers to the total number of peptide spectra identified for a protein and is considered a semiquantitative measurement of protein abundance. Proteins were identified with a >95% probability. For three cases, samples were derived from more than one organ type: *heart and gastrointestinal tract (GI-tract; not otherwise specified); **lung and skin; ***heart, subcutaneous fat aspirate (SFA) and large intestine.
![Figure 4. Proteomics data obtained by literature search. Occurrences of apolipoprotein E (A), complement 9 (B) and complement 3 (C) in amyloid tissue sections are depicted for amyloid and organ type. Proteomic data were reviewed and extracted from amyloidosis cases analyzed by LMD LC–MS/MS (method described in [Citation9–11]). The total number of patients tested is indicated by data point area. Positive cases are colored/grey scaled depending on the number of spectras’ median measured, whereas negative cases are depicted by black areas. The number of spectra refers to the total number of peptide spectra identified for a protein and is considered a semiquantitative measurement of protein abundance. Proteins were identified with a >95% probability. For three cases, samples were derived from more than one organ type: *heart and gastrointestinal tract (GI-tract; not otherwise specified); **lung and skin; ***heart, subcutaneous fat aspirate (SFA) and large intestine.](/cms/asset/3d7eee5e-3f53-4018-9d58-de857ab70d84/iamy_a_1932799_f0004_c.jpg)