Figures & data
Figure 1. Amyloid load in wells exposed to the crude fractions F1 to F48 from the pH 9.0 eluate, as quantified by ThT fluorescence after incubation of the cells for 48 h (n = 3). Black circles: individual data points. Grey bars: average value. Error bars: standard deviation. The ThT intensity was plotted relative to wells in which cells were incubated without library fractions (c), which were set to 100%.
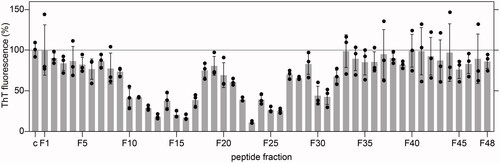
Figure 2. Mass spectrometric analysis of subfractions S17 and S18. (A) Full-range averaged mass spectra of subfractions S17 and S18, which were summed up over the entire elution period of the HPLC column (65 min). The dominant charge series (z = 9 to z = 14), corresponding to full-length lysozyme, is labelled in both spectra. (B) Deconvoluted mass spectra of the data shown in panel (A). The experimental monoisotopic masses of the main peaks, which correspond to the main peak series in (A), are indicated. The theoretic monoisotopic mass of lysozyme is 14,691.2 Da.
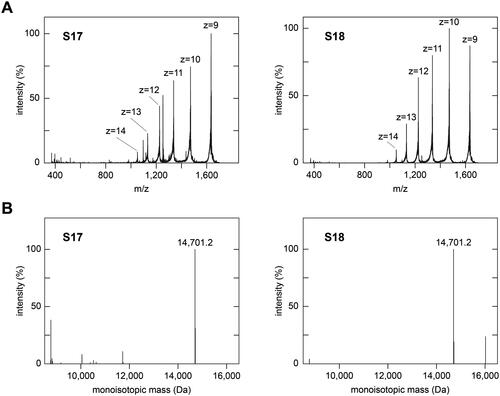
Figure 3. Lysozyme inhibits SAA fibril formation in the cell model. (A) Ribbon diagram (left) and surface representation (right) of human lysozyme (protein data bank: 1REX). N- and C-terminus are indicated. Asterisk: substrate binding cavity. (B) Plot of the amyloid load as quantified by ThT fluorescence and of the cell metabolic activity as quantified based on the MTT reduction after incubation of the cells with different concentrations of lysozyme for 48 h (n = 3). Black circles: amyloid load; open circles: MTT reduction. Error bars: standard deviation. ThT intensity and MTT reduction were plotted relative to samples containing no lysozyme, which were set to 100%.
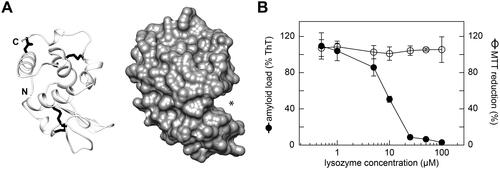
Figure 4. Interaction of lysozyme with SAA protein and SAA fragments. (A) SPR response units obtained upon binding of different concentrations of soluble lysozyme to immobilised SAA. The data were fitted with formula (1) and are representative of three individual experiments (Supplementary Figure S6A-B). The KD value was determined at 16.5 ± 0.6 µM (n = 3). (B) Binding of lysozyme to a series of SAA-derived octa-peptides that were immobilised on the membrane. Bound lysozyme was visualised with an anti-lysozyme antibody. The data are representative of two individual experiments (Supplementary Figure S6C). (C) Sequence of murine SAA plotted side-by-side with the observed lysozyme-binding SAA peptide fragments (grey bars below the sequence). The common shared sequence motifs of the binding peptides are indicated by the grey boxes.
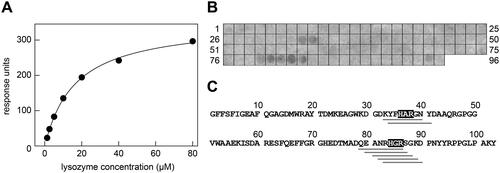
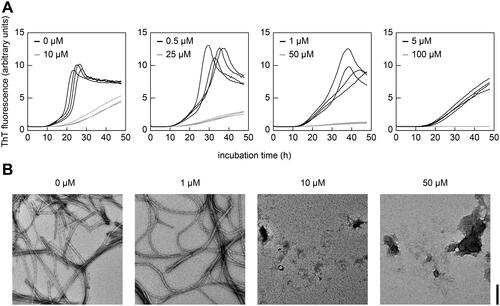
Figure 5. Lysozyme inhibits SAA fibril formation in a cell-free assay. (A) Real-time ThT fluorescence measurements of the cell-free formation of SAA fibrils in the presence of different concentrations of lysozyme (0 to 100 µM) as indicated in the figure (n = 4). (B) TEM images of representative samples from panel (A) at the end of incubation period. Scale bar: 200 nm.