Figures & data
Table 1. Baseline characteristics.
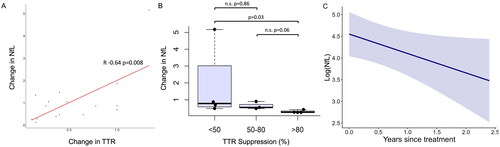
Figure 1. Correlations between logged neurofilament light chain concentrations (log(NfL), pg/ml) and examination scores (A-F). A: Neuropathy impairment score (NIS), B: Neuropathy impairment score, lower limb subset (NIS-LL), C: Rasch-modified Charcot-Marie-Tooth symptom score CMTSS), D: Rasch-modified Charcot-Marie-Tooth symptom and examination score (CMTES), E: Rasch-modified Charcot-Marie-Tooth neuropathy composite score (CMTNS) and F: Medical Research Council score (MRC).
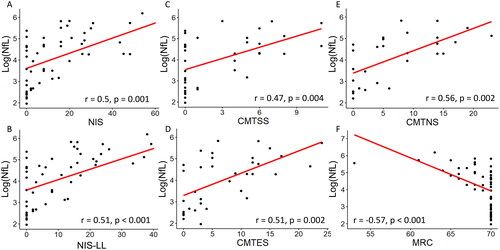
Figure 2. Serum neurofilament light chain (NfL) increases with disease severity (A-B) and with transition to symptomatic disease (C-D). A-B: Baseline logged neurofilament light chain (log(NfL), pg/ml) increases with increasing peripheral neuropathy disability (PND) scores (A) and familial amyloid polyneuropathy (FAP) stage (B). Black circles indicate raw data values. C-D: Longitudinal evaluation of logged neurofilament light chain (log(NfL), pg/ml) levels according to clinical group as assessed by generalised linear mixed model. C: Differences in log(NfL) over time can be distinguished by group status demonstrating significant increases in symptomatic and sensorimotor converters irrespective of time, when compared to asymptomatic and sensory converting patients, D: Longitudinal changes (years) in log(NfL) according to group status, where A: Asymptomatic (yellow), SC: Sensory converters (red), MC: Sensorimotor converters (aqua) and S: Symptomatic (green) groups.
Individuals were characterised as asymptomatic (A) if they remained asymptomatic throughout the follow-up period with PND 0, MRC 70 and NIS 0. Symptomatic individuals (S) had evidence of a symptomatic neuropathy at baseline and throughout the follow-up period, with NIS > 5 or MRC score < 70 and PND score of 1 or above at baseline. An individual was categorised as a sensory converter (SC), if they were asymptomatic at initial review and during follow-up they transitioned from PND or FAP scores of 0 to 1, NIS 0 to > 0 and maintained an MRC score of 70. Sensorimotor converters (MC) were individuals who were asymptomatic at baseline and converted from a PND score of 0 or 1 to a score of ≥ 2 and developed muscle weakness (MRC score < 70).
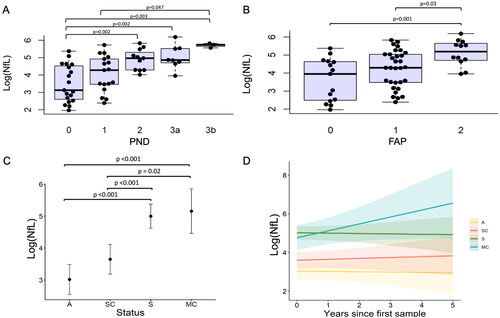
Table 2. Baseline characteristics of longitudinal groups.
Table 3. NfL cut-off values: sensitivity and specificity.
Figure 3. Post-treatment alterations in neurofilament light chain (NfL). A: Change in NfL correlates with change in transthyretin (TTR). Change in NfL and TTR are both calculated as recent post-treatment concentration divided by baseline pre-treatment concentration; B: Greater reduction in NfL (<1: reduction, >1: increase) is found with increasing TTR suppression (%). C: Longitudinal evaluation (years) of logged neurofilament light chain (log(NfL), pg/ml) concentration after effective treatment (>50% TTR suppression) as assessed by generalised linear mixed model. Black circles indicate raw data values.