Figures & data
Figure 1. Static screenshot example of the search display in the discrete case. In the example, set size = 9; target bar = horizontal.
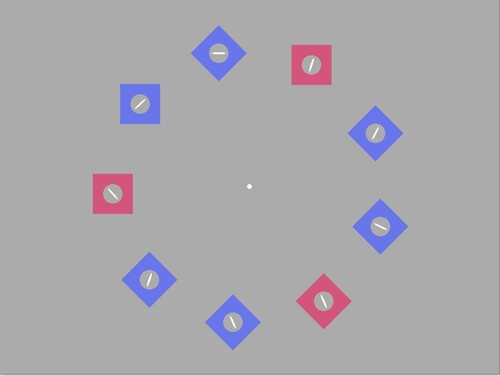
Figure 2. Median correct response times for the individual target–distractor combinations for discrete trials (left and right column, respectively) for Experiments 1 and 2 (top and bottom rows, respectively). Set size is on the abscissa; the ordinate depicts the cross-participant median correct response time (ms). Target rate is indicated by marker shape: triangle = 1.79 Hz; circle = 3.57 Hz, square = 7.14 Hz. The line colour denotes the distractor: black line = 1.79 Hz; dark-grey line = 3.57 Hz; light-grey = 7.14 Hz. Separate lines are given for each target–distractor combination (A–G). Condition is denoted by the dash type of the line and the marker fill: solid line + solid fill denotes baseline (T = D), long-dashed line + marker with horizontal black–white stripes = the slower target (T < D), short-dotted line + marker with vertical black–white stripes = faster target condition (T > D). Error bars show ±1 standard error.
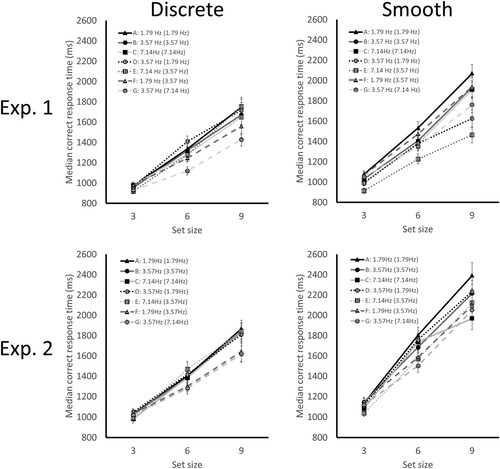
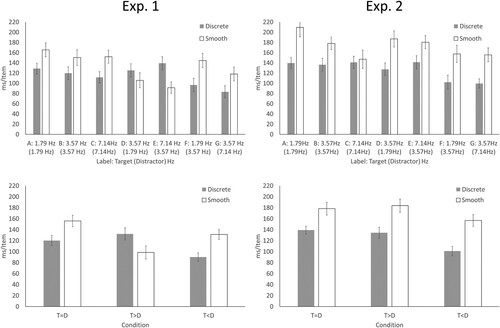
Figure 3. The top row depicts search slopes (ms/item) for the seven target–distractor combinations (A–G) for the discrete and smooth trials. The bottom row depicts mean search slopes calculated across the corresponding trial types for the three conditions (baseline, T = D; faster target, T > D; slower target, T < D). Error bars show ±1 standard error.