
Figures & data
Figure 1. Cumulative losses (USD bn) of climate risk events 1980–2020.
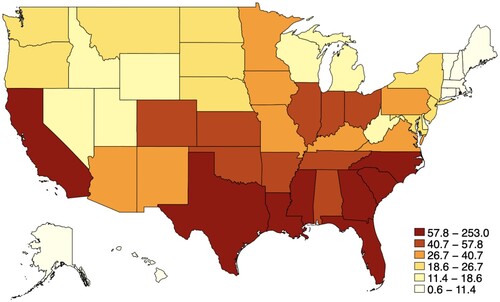
Figure 2. Cumulative frequency of climate risk events 1980–2020.
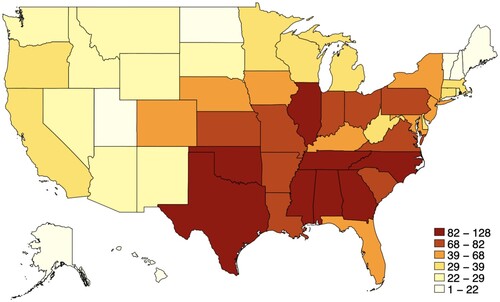
Table 1. Sample selection for climate risk measurement.
Figure 3. Scree plot of eigenvalues after PCA.
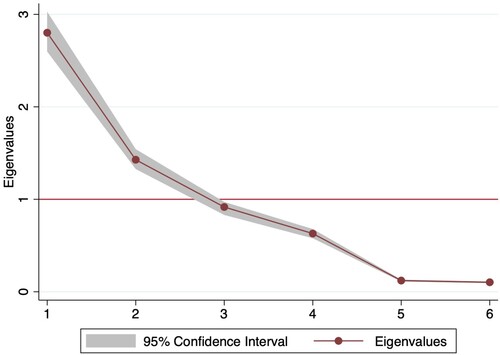
Table 2. Principal component analysis results.
Table 3. Sample composition.
Table 4. Descriptive statistics.
Table 5. Correlation.
Table 6. The effects of climate risk on banks' individual and systemic risks.
Table 7. The effects of climate risk on banks' individual and systemic risks: the moderating role of bank profitability.
Table 8. The effects of climate risk on banks' individual and systemic risks: business cycle and financial crisis.
Table 9. The effects of climate risk on banks' subsequent lending behavior.
Table 10. Alternative climate risk measures.
Table 11. Alternative loan samples.
Table 12. Weighted least squares.
Table 13. Standard errors.
Table 14. Alternative fixed effects specifications.
Table 15. Loan-level analyzes: main results.
Table 16. Loan-level analyzes: the moderating role of loan purposes
Table 17. Loan-level analyzes: alternative fixed effects specifications.