258
Views
0
CrossRef citations to date
0
Altmetric
Research Article

Network analysis and teaching excellence as a concept of relations

ORCID Icon &
Received 17 Oct 2023, Accepted 04 Mar 2024, Published online: 22 Apr 2024

Figures & data

Figure 1. A graphical representation of a network analysis. Nodes include: Course = The teaching on my course. Opp = Learning opportunities. Feed = Assessment and feedback. Supp = Academic support. Org = Organisation and management. Res = Learning resources. Com = Learning community. Voice = Student voice. Satisfaction = Summative question.

Figure 1. A graphical representation of a network analysis. Nodes include: Course = The teaching on my course. Opp = Learning opportunities. Feed = Assessment and feedback. Supp = Academic support. Org = Organisation and management. Res = Learning resources. Com = Learning community. Voice = Student voice. Satisfaction = Summative question.

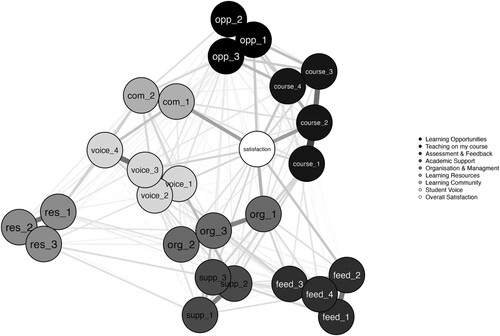
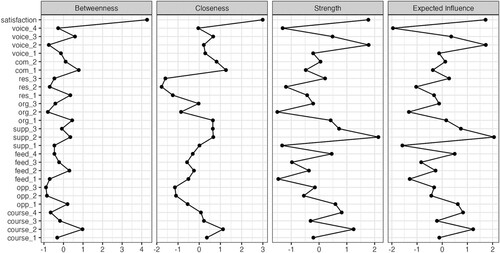
Figure 2. centrality plots, associated with the network in .

Figure 2. centrality plots, associated with the network in Figure 1.
Supplemental material

Appendix_1_NSS_questions_used_in_the_profiled_example.docx

Download MS Word (18 KB)