Figures & data
Table 1. The cognitive function checklist in the health check section of the preventive care checklist.
Figure 1. Flowchart showing enrollment, randomization, and data analysis of study participants.
Table 2. Schedule of the MMT exercise program using the Naruko clapper and the control exercise program.
Figure 2. Measurement methods conducted during intervention (intervention and control groups were separated).
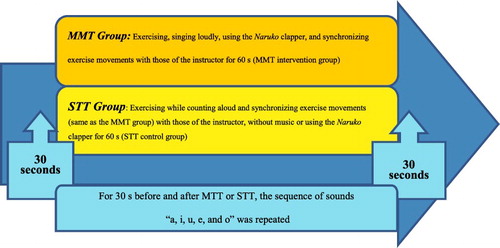
Figure 3. Research category and research period.
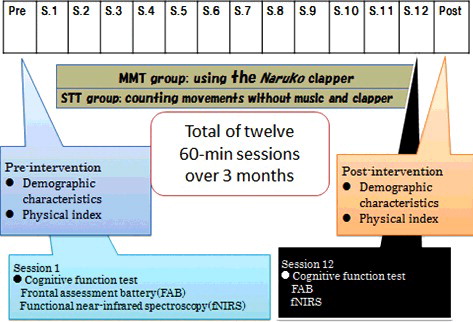
Figure 4. Regions measured with near-infrared spectroscopy (NIRS).
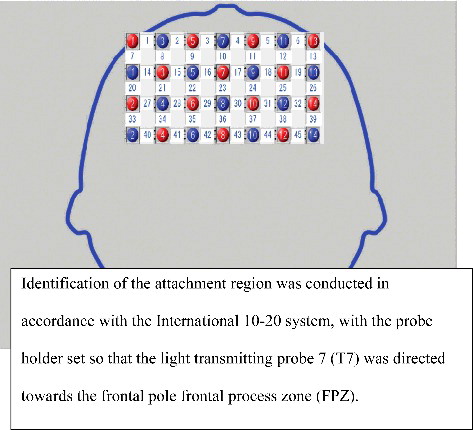
Figure 5. Specifying brain coordinate locations using NIRS-SPM.
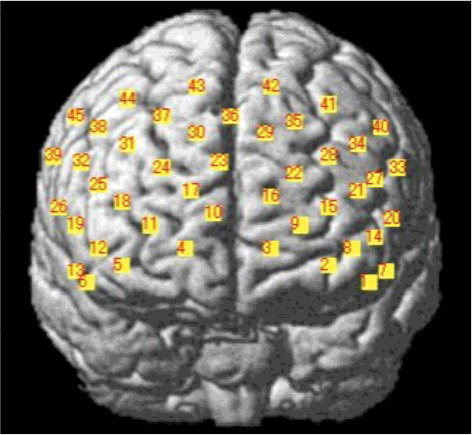
Table 3. Participant characteristics.
Table 4. Results of physical function tests at baseline in the MMT and STT groups.
Table 5. Results of physical function tests before and after interventions in each group (p < .05).
Figure 6. Brodmann area 10.
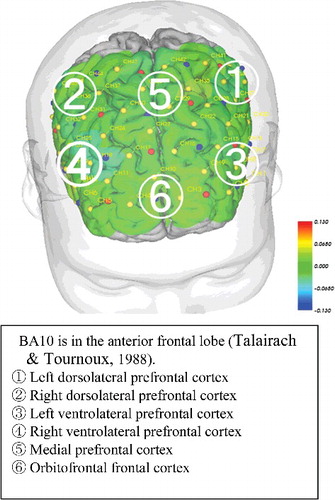
Table 6. Pre- and post-intervention results for the six subsets of the Frontal Assessment Battery in each group (p < .05).
Table 7. Pre- and post-intervention differences in integral value (oxy-HbTable Footnotea) at channels in the left temporal region, i.e. task-related changes in the integral values of oxy-Hb concentrations (p < .05)
Table 8. Pre- and post-intervention differences in integral value (oxy-HbTable Footnotea) at channels in the right temporal region (p < .05).
Table 9. Pre- and post-intervention differences in integral value (oxy-HbTable Footnotea) at channels in the frontal temporal region (p < .05).
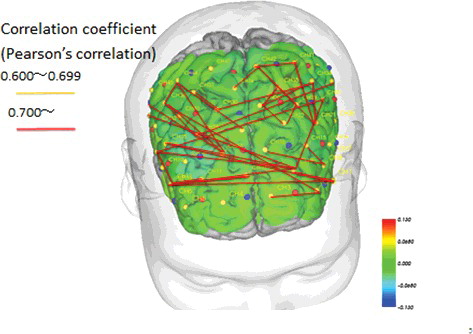
Figure 7. Pre- and post-intervention brain blood flow and correlations between channels in the MMT group (p < .05).
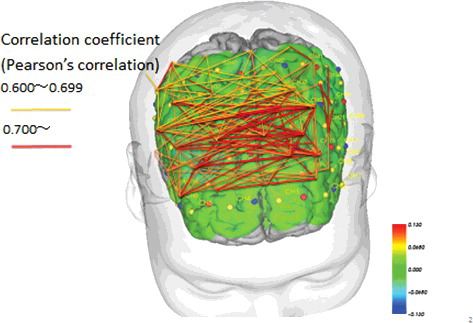
Figure 8. Pre- and post-intervention brain blood flow and correlations between channels in the STT group (p < .05).