
Figures & data
Figure 1. Real price of farmed salmon and unit production cost 1986–2022 (NOK per kilo whole fish equivalent, WFE). Data was collected from The Norwegian Directorate of Fisheries, with interest costs replaced with capital costs calculated as eight percent multiplied by total assets. Prices and costs deflated with the Norwegian consumer price index from Statistics Norway (2022 = 1).
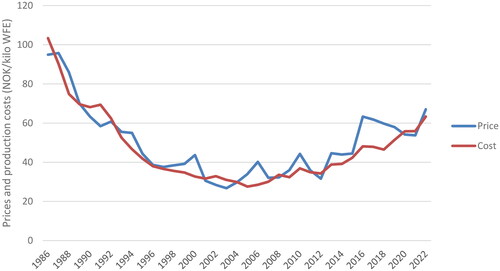
Table 1. Descriptive statistics of the returns of the companies.
Figure 2. Plot of cumulative returns for treatment and control groups.
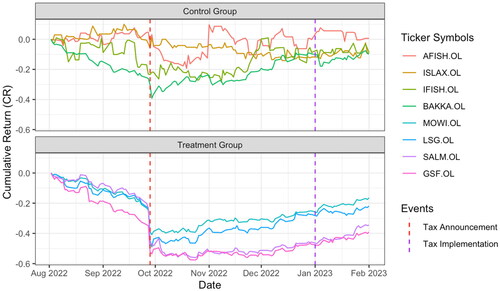
Table 2. Difference-in-differences model for returns on announcement day with robust standard errors.
Table 3. Difference-in-differences model for returns on implementation day with robust standard errors.