Figures & data
Table I. Subjects' baseline characteristics in study B.
Figure 1. Pharmacokinetic profile of TT (solid squares) and DHT (open squares) after single-dose administration of different doses of MPP 10 in study A. 7.6 mg T (squares), 15.2 mg T (circles), 22.8 mg T (triangles). Dashed line denotes lower limits of normal range of TT based on morning serum samples. Error bars denote mean ± SD.
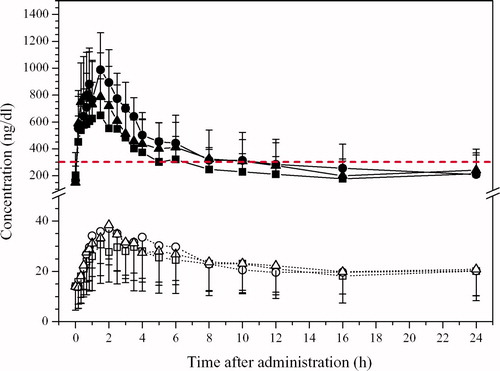
Table II. Pharmacokinetic parameters of TT in study A after single escalating doses of MPP 10 in 8 men.
Figure 2. Pharmacokinetic profile of TT and DHT after nasal administration of MPP 10 in different dosing schemes (Study B, after 14 days of treatment). ‘Time 0’ means 08:00 h; dashed lines denote upper (TT and DHT) and lower (TT) limits of normal range based on morning serum samples. Error bars denote mean ± SD.
Table III. Study B.
Table IV. Study B.
Figure 3. Overall CGS for study B.
Figure 4. Pharmacokinetic profile of TT in group B2 on last day of treatment (study B, day 14) in comparison with profile of a healthy young man (data taken from Diver Citation[37]; ‘time 0’ means 08:00 h). Dashed lines denote upper and lower limits of normal range based on morning serum samples.
![Figure 4. Pharmacokinetic profile of TT in group B2 on last day of treatment (study B, day 14) in comparison with profile of a healthy young man (data taken from Diver Citation[37]; ‘time 0’ means 08:00 h). Dashed lines denote upper and lower limits of normal range based on morning serum samples.](/cms/asset/a2031dab-2ccb-4251-ba16-c7f68a56d0a0/itam_a_335364_f0004_b.jpg)