2,694
Views
23
CrossRef citations to date
0
Altmetric
Original Article

The impact of testosterone replacement therapy on glycemic control, vascular function, and components of the metabolic syndrome in obese hypogonadal men with type 2 diabetes

, , , &
Pages 158-169 | Received 13 Apr 2018, Accepted 19 Apr 2018, Published online: 30 Apr 2018

Figures & data

Figure 1. HbA1c values in obese hypogonadal DM2 patients before and after one year of TRT or placebo (intra- and inter-group differences and corresponding p values shown in ); HbA1c: glycated hemoglobin A1c (%), P: placebo group, T: testosterone group, time point T0: before and T1: after one year of study.

Figure 1. HbA1c values in obese hypogonadal DM2 patients before and after one year of TRT or placebo (intra- and inter-group differences and corresponding p values shown in Table 1); HbA1c: glycated hemoglobin A1c (%), P: placebo group, T: testosterone group, time point T0: before and T1: after one year of study.

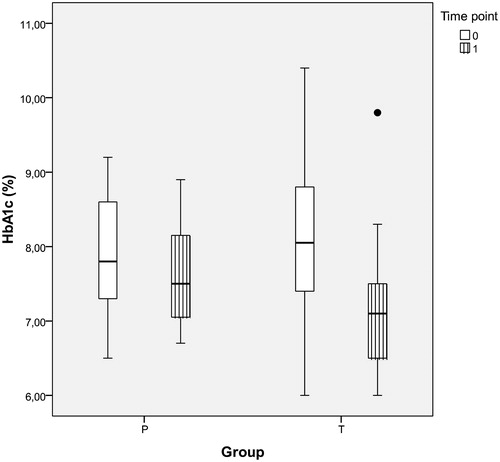
Table 1. Anthropometric and metabolic parameters in obese hypogonadal DM2 patients before in after one year of TRT or placebo.

Figure 2. HOMA-IR in obese hypogonadal DM2 patients before and after one year of TRT or placebo (intra- and inter-group differences and corresponding p values shown in ); HOMA-IR (homeostasis model assessment insulin resistance index), P: placebo group, T: testosterone group, time point T0: before and T1: after one year of study.

Figure 2. HOMA-IR in obese hypogonadal DM2 patients before and after one year of TRT or placebo (intra- and inter-group differences and corresponding p values shown in Table 1); HOMA-IR (homeostasis model assessment insulin resistance index), P: placebo group, T: testosterone group, time point T0: before and T1: after one year of study.

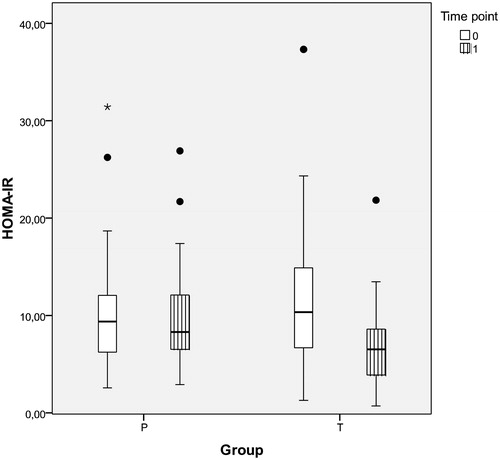
Table 2. Testosterone levels in obese hypogonadal DM2 patients before and after one year of TRT or placebo.

Figure 3. FMD in obese hypogonadal DM2 patients before and after one year of TRT or placebo (intra- and inter-group differences and corresponding p values shown in ); FMD (flow mediated dilatation, %), P: placebo group, T: testosterone group, time point T0: before and T1: after one year of study.

Figure 3. FMD in obese hypogonadal DM2 patients before and after one year of TRT or placebo (intra- and inter-group differences and corresponding p values shown in Table 3); FMD (flow mediated dilatation, %), P: placebo group, T: testosterone group, time point T0: before and T1: after one year of study.

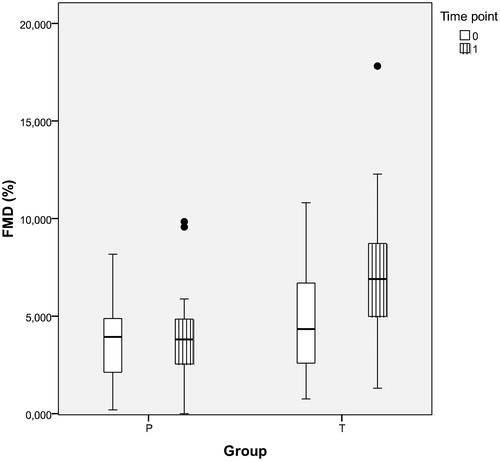
Table 3. FMD and IMT results in obese hypogonadal DM2 patients before and after one year of TRT or placebo.

Reprints and Corporate Permissions

Please note: Selecting permissions does not provide access to the full text of the article, please see our help page How do I view content?

To request a reprint or corporate permissions for this article, please click on the relevant link below:

Academic Permissions

Please note: Selecting permissions does not provide access to the full text of the article, please see our help page How do I view content?

Obtain permissions instantly via Rightslink by clicking on the button below:

If you are unable to obtain permissions via Rightslink, please complete and submit this Permissions form. For more information, please visit our Permissions help page.