Figures & data
Table 1. Comparative properties of testosterone and control groups before the start of treatment.
Figure 1. (a) BMI decreased from baseline over the 5-year period after TU treatment, after ceasing TTH, BMI returned to near baseline (Tb group). (b) A significant increase in total T is observed from baseline over the 5-year period compared with the control group. (c) A significant increase in free T is observed from baseline over the 5-year period after TU treatment. (d) A significant decrease is observed at both the 2- and 5-year intervals after TU treatment. (e) After TTH treatment, a significant decrease in total cholesterol levels are observed over the first 2 years. (f) After TTH treatment, a significant decrease in triglyceride levels is observed over the first 2 years. (g) After TTH treatment, a significant decrease in LDL cholesterol levels is observed over the first 2 years. (h) No significant change in HDL cholesterol levels are observed over the course of the study in any group observed.
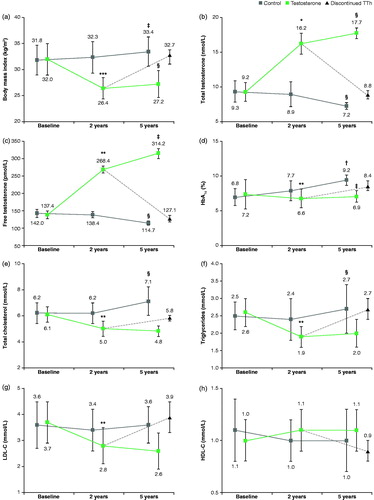
Table 2. Comparative properties of testosterone and control groups 2 years after stroke.
Table 3. Comparative properties of testosterone and control groups 5 years after stroke (differences between 2 and 5 years after the treatment).
Figure 2. (a) After TTH treatment, a significant decrease in SAP is observed over the first 2 years. (b) After TU treatment, a significant decrease in SAP is observed over the first 2 years.
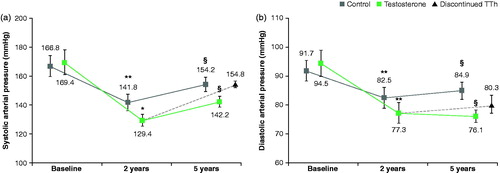
Figure 3. (a) A significant increase in muscle strength was observed between baseline and the 2-year follow-up. (b) A significant decrease in AMS was observed between baseline and the 2-year follow-up with further significant improvements observed at 5 years. (c) A significant decrease in Beck depression scores was observed between baseline and the 2-year follow-up with further significant improvements observed at 5 years.
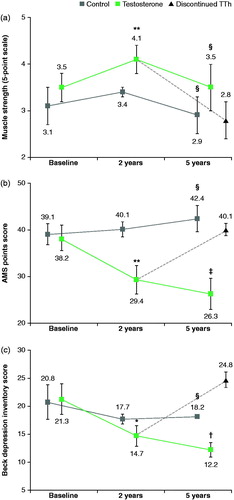
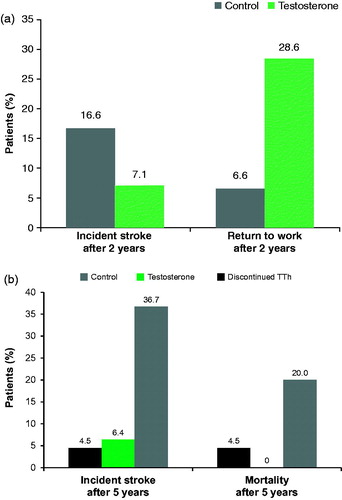
Figure 4. (a) A significant difference in the rate of reoccurring stoke is observed between the TU and control group after 2 years. (b) A significant difference in the rate of mortality is observed between those that remain on TTH and those who are either in the control group or have ceased treatment at the 5-year follow-up.