Figures & data
Figure 1. Bone mineral density, BMD (g/cm2) measured in lumbar vertebrae (LBMD) and in femur (FMBD). Three-month-old male Wistar rats: sham-operated rats (SHAM) and orchidectomized rats as baseline and castrated rats treated with 10 mg/kg of OPG–Fc twice weekly (ORX + OPG–Fc) or testosterone cypionate (1.7 mg/kg/once a week) (ORX + testosterone). Data are expressed as mean ± SD of 15 animals/group in the case of FMBD and 23 animals/group in the case of LMBD. Statistical significance: a vs SHAM; b vs ORX; c vs ORX + OPG–Fc. LBMD: ORX vs SHAM p < .001; ORX + OPG–Fc vs ORX p < .001; ORX + testosterone vs ORX p < .05; ORX + testosterone vs ORX + OPG–Fc p < .05. FBMD: ORX vs SHAM p < .01; ORX + OPG–Fc vs ORX p < .001; ORX + testosterone vs ORX + OPG–Fc p < .05.
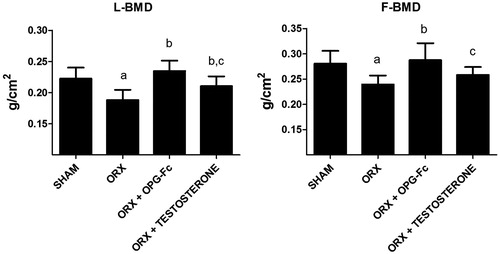
Figure 2. Femoral trabecular microarchitecture analysis: bone volume/tissue volume (BV/TV), bone surface/bone volume (BS/BV), bone surface/tissue volume (BS/TV), trabecular thickness (TbTh), trabecular separation (TbSp), trabecular number (TbN). Three-month-old male Wistar rats: Sham-operated rats (SHAM) and orchidectomized rats (ORX) as baseline and castrated rats treated with 10 mg/kg of OPG–Fc twice weekly (ORX + OPG–Fc) or testosterone cypionate (1.7 mg/kg/once a week) (ORX + testosterone). Data are expressed as mean ± SD with 15 animals/group. Statistical significance: a vs SHAM; b vs ORX; c vs ORX + OPG–Fc. BV/TV: ORX vs SHAM p < .01; ORX + OPG–Fc vs SHAM p < .05; ORX + testosterone vs SHAM p < .05; ORX + OPG–Fc vs ORX p < .05; ORX + testosterone vs ORX p < .05. BS/BV: ORX + OPG–Fc vs SHAM p < .01; ORX + OPG–Fc vs ORX p < .01; ORX + testosterone vs ORX + OPG–Fc p < .001. BS/TV: ORX vs SHAM p < .01; ORX + OPG–Fc vs SHAM p < .05; ORX + OPG–Fc vs ORX p < .05; ORX + testosterone vs SHAM p < .05; ORX + testosterone vs ORX p < .05. TbTh: ORX + OPG–Fc vs SHAM p < .01; ORX + OPG–Fc vs ORX p < .01. TbSp: ORX vs SHAM p < .01; ORX + OPG–Fc vs ORX p < .01; ORX + testosterone vs SHAM p < .05; ORX + testosterone vs ORX p < .05; ORX + testosterone vs ORX + OPG–Fc p < .05. TbN: ORX vs SHAM p < .01; ORX + OPG–Fc vs SHAM p < .05; ORX + OPG–Fc vs ORX p < .05; ORX + testosterone vs SHAM p < .05; ORX + testosterone vs ORX p < .05.
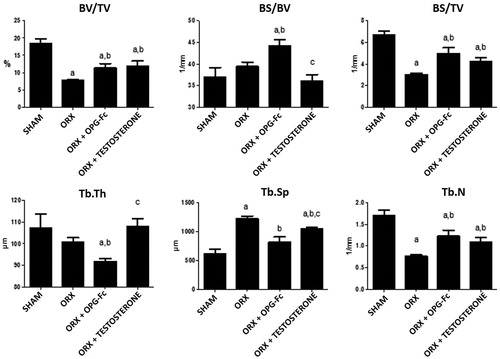
Figure 3. Nonmetric femoral trabecular microarchitecture analysis: trabecular pattern factor (TbPf), structural model index (SMI), and anisotropy degree (DA). Three-month-old male Wistar rats: sham-operated rats (SHAM) and orchidectomized rats (ORX) as baseline and castrated rats treated with 10 mg/kg of OPG–Fc twice weekly (ORX + OPG–Fc) or testosterone cypionate (1.7 mg/kg/once a week) (ORX + testosterone). Data are expressed as mean ± SD of 15 animals/group. Statistical significance: a vs SHAM; b vs ORX; c vs ORX + OPG–Fc. TbPf: ORX vs SHAM p < .05; ORX + OPG–Fc vs SHAM p < .01. SMI: ORX vs SHAM p < .05; ORX + OPG–Fc vs SHAM p < .05.
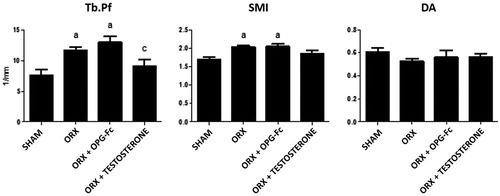
Figure 4. Representative images of bone trabecular 3D microarchitecture in femur sections in groups obtained by computed microtomography. Three-month-old male Wistar rats: Sham-operated rats (SHAM) and orchidectomized rats (ORX) as baseline and castrated rats treated with 10 mg/kg/twice a week of OPG–Fc (ORX + OPG–Fc) or testosterone cypionate (1.7 mg/kg/once a week) (ORX + testosterone).
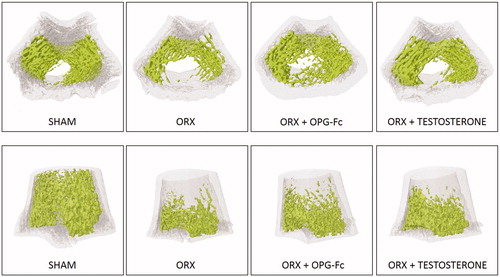
Figure 5. Cortical mocroarchitecture analysis: cortical thickness (CtTh), cortical volume (CtV), medullary volume (MV), cross-sectional thickness (CsTh), mean total cross-sectional bone area (BAr), cortical periostal perimeter (CtPePm), cortical endosteal perimeter (CtEnPm), mean polar moment of inertia (MMI), and mean excentricity (Ecc). Three-month-old male Wistar rats: sham-operated rats (SHAM) and orchidectomized rats (ORX) s as baseline and castrated rats treated with 10 mg/kg/twice a week of OPG–Fc (ORX + OPG–Fc) or testosterone cypionate (1.7 mg/kg/once a week) (ORX + testosterone). Data are expressed as mean ± SD of 15 animals/group. Statistical significance: a: p < .05, significant vs SHAM group.
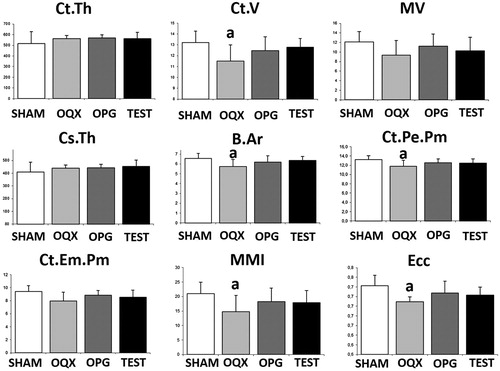
Figure 6. Representative images of bone cortical microarchitecture in femur sections in groups obtained by computed microtomography. Three-month-old male Wistar rats: sham-operated rats (SHAM) and orchidectomized rats (ORX) as baseline and castrated rats treated with 10 mg/kg/twice a week of OPG–Fc (ORX + OPG–Fc) or testosterone cypionate (1.7 mg/kg/once a week) (ORX + testosterone).
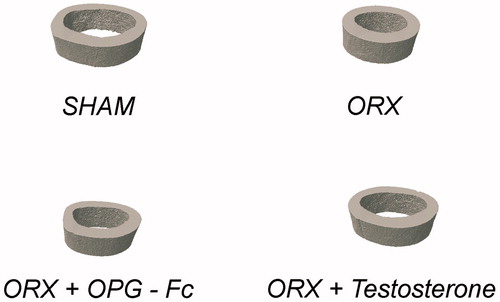
Figure 7. Serum biochemical markers of bone turnover: osteocalcin (BGP), total alkaline phosphatase (ALP), and telopeptide carboxy terminal of collagen I (CTX). Three-month-old male Wistar rats: sham-operated rats (SHAM) and orchidectomized rats (ORX)as baseline and castrated rats treated with 10 mg/kg/twice a week of OPG–Fc (ORX + OPG–Fc) or testosterone cypionate (1.7 mg/kg/once a week) (ORX + testosterone). Data are expressed as mean ± SD of 15 animals/group. Statistical significance: a vs SHAM; b vs ORX; c vs ORX + OPG–Fc. BGP: ORX + OPG–Fc vs SHAM p < .001; ORX + testosterone vs SHAM p < .05; ORX + OPG–Fc vs ORX p < .001; ORX + testosterone vs ORX + OPG–Fc p < .001. ALP: ORX vs SHAM p < .05; ORX + OPG–Fc vs ORX p < .01; ORX + testosterone vs ORX p < .05; ORX + testosterone vs ORX + OPG–Fc p < .05. CTX: ORX vs SHAM p < .05; ORX + OPG–Fc vs ORX p < .05; ORX + testosterone vs SHAM p < .05; ORX + testosterone vs ORX + OPG–Fc p < .05.
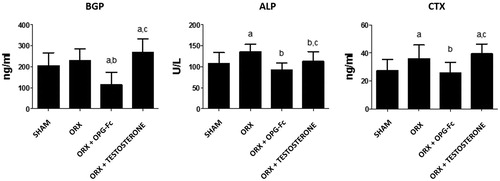
Figure 8. Coronal planes of femur performed by X-ray. Three-month-old male Wistar rats: sham-operated rats (SHAM) and orchidectomized rats (ORX) as baseline and castrated rats treated with 10 mg/kg/twice a week of OPG–Fc (ORX + OPG–Fc) or testosterone cypionate (1.7 mg/kg/once a week) (ORX + testosterone).
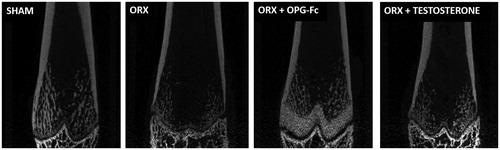
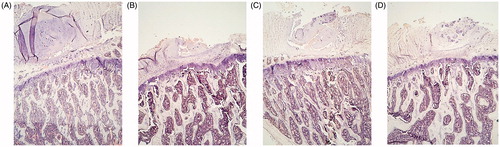
Figure 9. Safranin staining 4×. Cortical component of the L4 vertebrae. Sham-operated rats (SHAM) (A) and orchidectomized rats (ORX) (B) as baseline and castrated rats with 10 mg/kg/twice a week of OPG–Fc (ORX + OPG–Fc) (C) or testosterone cypionate (1.7 mg/kg/once a week) (ORX + testosterone) (D). Safranin staining. Magnification 4×. Safranin staining let orient the samples in a same plane, because growing palates are identified in red, staying in an upper and lower view.
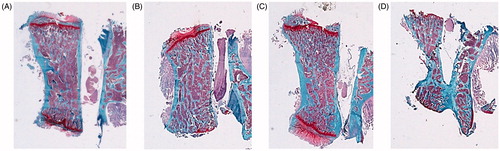
Figure 10. Hematoxylin-eosin staining 4×. Trabecular component of the L4 vertebrae. Sham-operated rats (SHAM) (A) and orchidectomized rats (ORX) (B) as baseline and castrated rats treated with 10 mg/kg of OPG–Fc twice weekly (ORX + OPG–Fc) (C) or testosterone cypionate (1.7 mg/kg/once a week) (ORX + testosterone) (D).
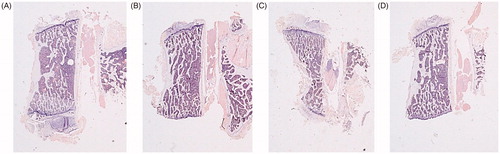
Figure 11. Hematoxylin eosin staining 100×. Trabecular component of the L4 vertebrae. Sham-operated rats (SHAM) (A) and orchidectomized rats (ORX) (B) as baseline and castrated rats treated with 10 mg/kg/twice a week of OPG–Fc (ORX + OPG–Fc) (C) or testosterone cypionate (1.7 mg/kg/once a week) (ORX + testosterone) (D). Greater magnification allowed us to better visualize the increase in trabecular thickness in the group of rats treated with testosterone.