Figures & data
Figure 1. Blood glucose levels in control and diabetic groups during the study period. Each point indicates mean standard error of the mean. ***p < 0.001.
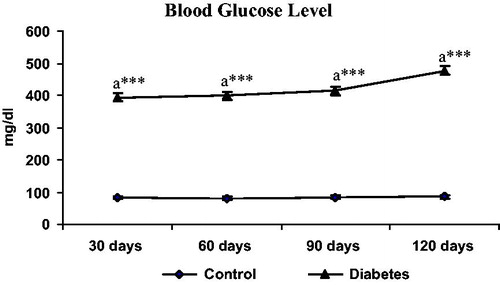
Figure 2. Hormonal status in control and diabetic groups, each bar represents the mean ± SEM. aControl, ***p < 0.001.
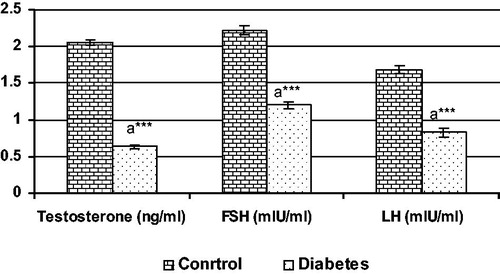
Figure 3. Various parameters studied under penile reflex in control and diabetic groups. Each bar represents the mean ± SEM. aControl, ***p < 0.001.
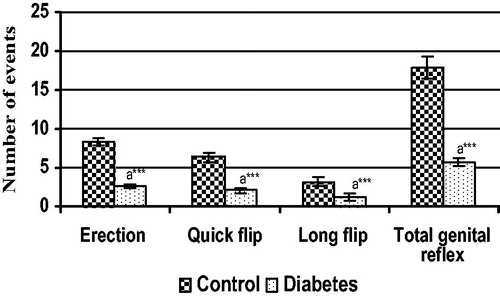
Figure 4. Electromyography showed activities of the IC and BS muscles in control and diabetic rats. Diabetic rat muscles showing diminish activities when compared to control indicting poor motor activity.
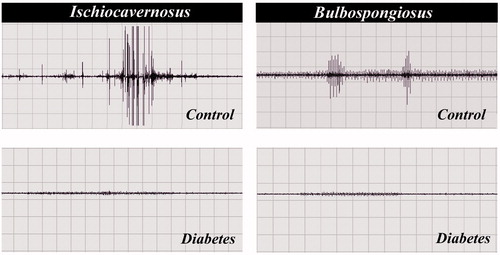
Figure 5. Various gross measurements of IC muscle in control and diabetic groups, each bar represents the mean ± SEM. aControl, **p < 0.01 and ***p < 0.001.
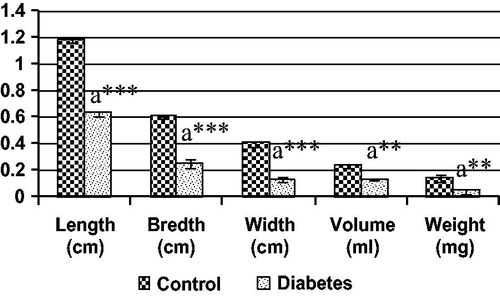
Figure 6. Various gross measurements of BS muscle in control and diabetic groups, each bar represents the mean ± SEM. aControl, **p < 0.01 and ***p < 0.001.
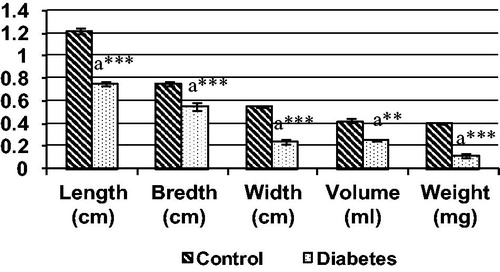
Figure 7. Morphology and histology of IC in control and diabetes. The IC muscle shows severe degenerative changes in diabetic rat. Figure showing transverse and longitudinal sections of muscle. H & E 40×.
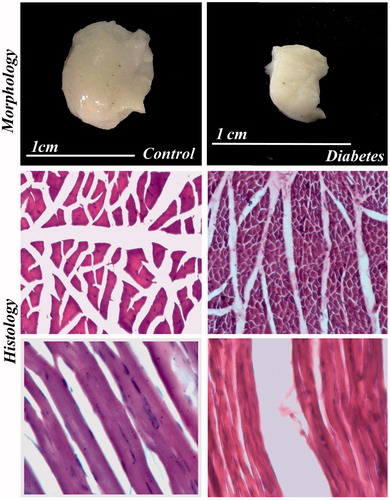
Figure 8. Morphology and histology of BS in control and diabetes. The BS muscle shows severe degenerative changes in diabetic rat. Figure showing transverse and longitudinal sections of muscle. H & E 40×.
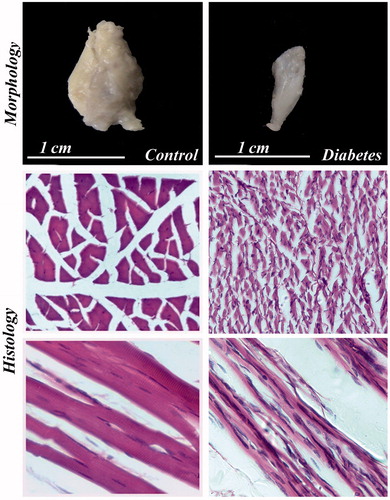
Table 1. Histomorphometry of IC and BS muscle fibers in control and diabetic rats.
Figure 9. Immunostaining of synaptophysin in IC muscle of control and diabetic rats. Expression of synaptophysin in IC muscle of diabetic rats was severely diminished when compared with control. 40×.
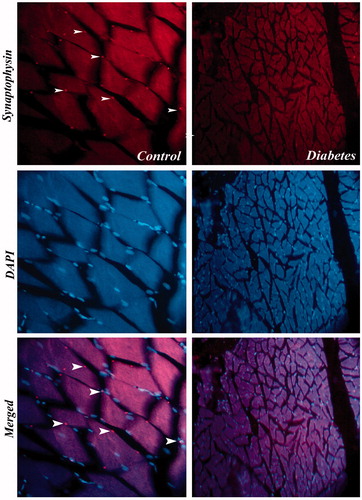
Figure 10. Immunostaining of synaptophysin in BS muscle of control and diabetic rats. Expression of synaptophysin in BS muscle of diabetic rats was severely diminished when compared with control. 40×.
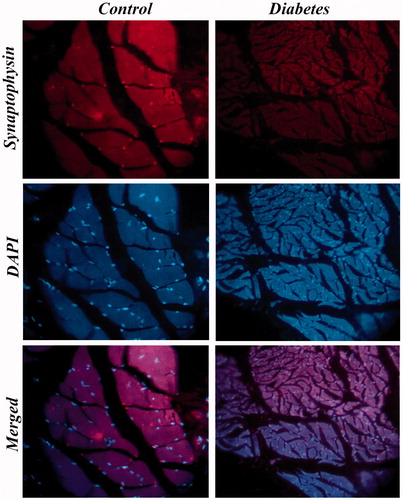
Figure 11. Immunostaining for nNOS IC and BS muscles of control and diabetic rats. Expression of nNOS in diabetic rat was severely diminished in these muscles when compared with control. 40×.
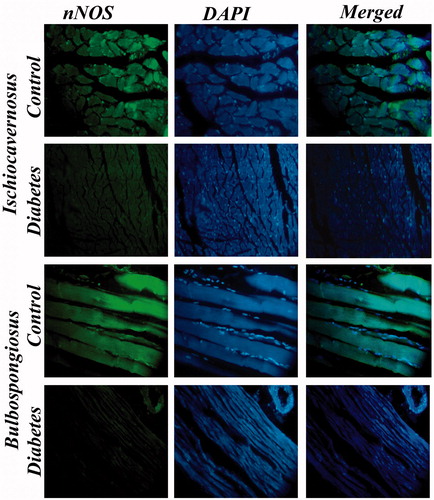
Figure 12. Images of histochemical staining for NADPH diaphorase. Staining showed severe depletion of enzyme in diabetic group IC and BS muscles when compared to control group. 40×.
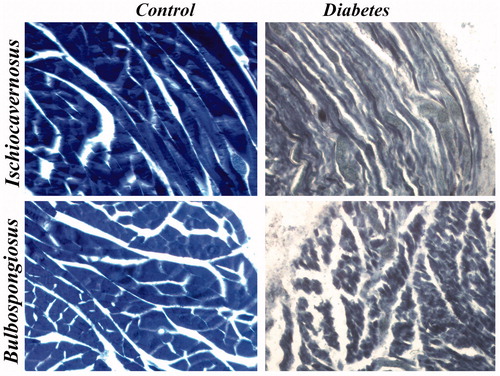
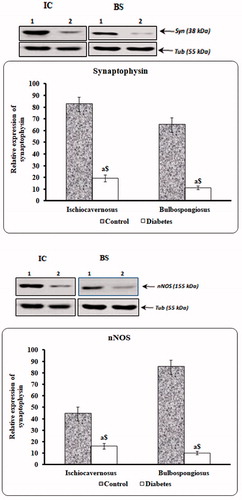
Figure 13. Immunoblot to estimate synaptophysin and nNOS proteins. Levels of these proteins were found to be significantly reduced in long-term diabetic animals when compared to control.