826
Views
0
CrossRef citations to date
0
Altmetric
Original Article

Differences in male climacteric symptoms with aging among rotating night shift workers

, , &
Pages 995-1003 | Received 22 Apr 2019, Accepted 27 Jul 2019, Published online: 09 Aug 2019

Figures & data

Table 1. Baseline characteristics.

Table 2. Proportion of AMS symptoms according to age.

Figure 1. Total AMS scores according to age. The bottom line, middle line and top line of box-and-whisker plot indicate 25 percentile, median, and 75 percentile, respectively. Crosses show the mean values. *20s vs 40s or 50s or 60s (p < 0.001), **30s vs 50s (p = 0.001)  ***30s vs 60s (p = 0.035).

Figure 1. Total AMS scores according to age. The bottom line, middle line and top line of box-and-whisker plot indicate 25 percentile, median, and 75 percentile, respectively. Crosses show the mean values. *20s vs 40s or 50s or 60s (p < 0.001), **30s vs 50s (p = 0.001)  ***30s vs 60s (p = 0.035).

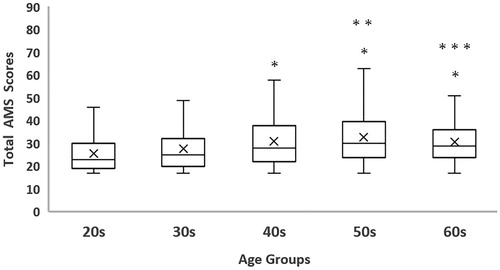
Table 3. Degrees of symptoms according to age.

Table 4. Psychological symptoms, somatic symptoms and sexual symptoms in AMS according to age.

Reprints and Corporate Permissions

Please note: Selecting permissions does not provide access to the full text of the article, please see our help page How do I view content?

To request a reprint or corporate permissions for this article, please click on the relevant link below:

Academic Permissions

Please note: Selecting permissions does not provide access to the full text of the article, please see our help page How do I view content?

Obtain permissions instantly via Rightslink by clicking on the button below:

If you are unable to obtain permissions via Rightslink, please complete and submit this Permissions form. For more information, please visit our Permissions help page.