
Figures & data
Table 1. Baseline characteristics of Testosterone treatment group (T-group) and control group (C-group).
Figure 1. Total testosterone (nmol/L) in 321 hypogonadal men on long-term treatment with testosterone undecanoate and 184 untreated hypogonadal controls. *p < 0.0001 between groups.
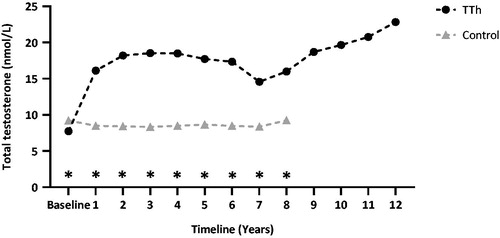
Figure 2. The Fatty Liver Index (FLI) in 321 hypogonadal men on long-term treatment with testosterone undecanoate and 184 untreated hypogonadal controls. *p < 0.0001 between groups.

Figure 3. γ-GT (A) and bilirubin levels (B) 321 hypogonadal men on long-term treatment with testosterone undecanoate and 184 untreated hypogonadal controls. Significance indicated between groups. *p < 0.0001.
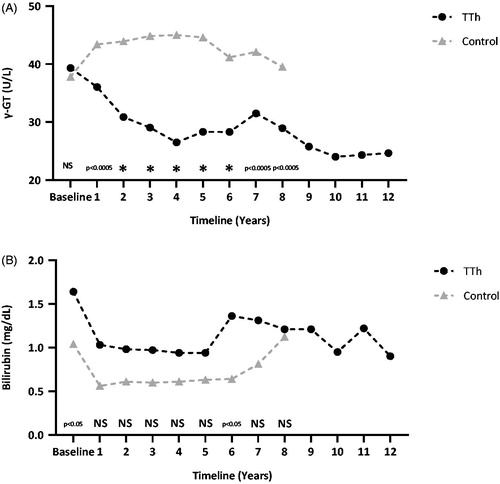
Figure 4. AST (A) and ALT (B) levels in 321 hypogonadal men on long-term treatment with testosterone undecanoate and 184 untreated hypogonadal controls. *p < 0.0001 between groups.
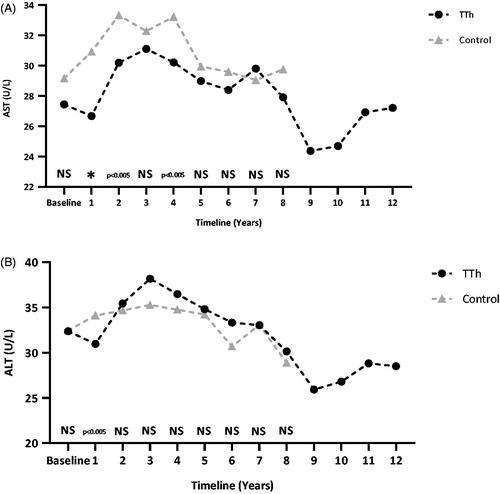
Figure 5. Triglyceride levels in 321 hypogonadal men on long-term treatment with testosterone undecanoate and 184 untreated hypogonadal controls. *p < 0.0001 between groups.
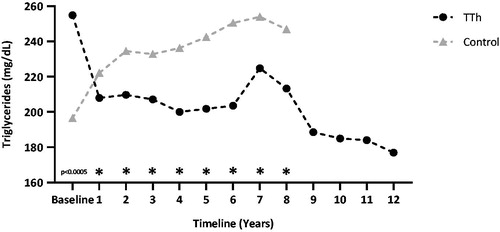
Figure 6. BMI (A) and waist circumference (B) of 321 hypogonadal men on long-term treatment with testosterone undecanoate and 184 untreated hypogonadal controls. *p < 0.0001 between groups.
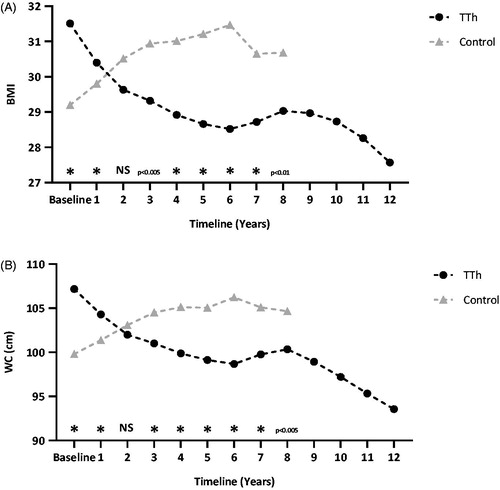
Table 2. Adverse events observed in testosterone treatment group (T-group) and control group (C-group).