
Figures & data
Figure 1. The Flowchart describes that how patients were selected.
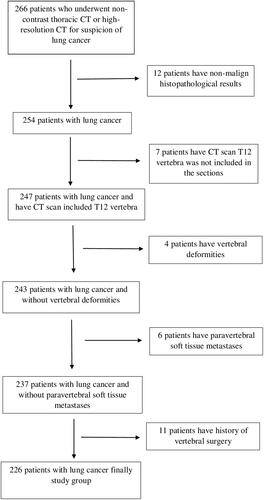
Figure 2. Left to right: (A) The axial computed tomography (CT) image was taken from the T12 vertebra spinous process level. (B) Measurement of the erector spinae muscle area (ESMa) on the axial CT section (window length, 40; window width, 300 HU). The threshold was set at −29 to +150 HU. ESMa was manually drawn on both sides using freehand regions of interest.
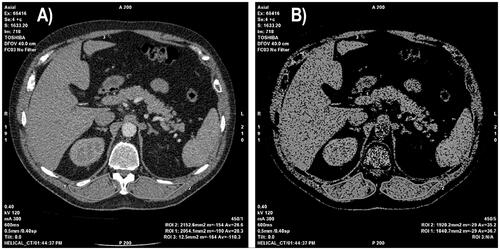
Table 1. Ages of the patients according to the T and M stage, histopathological subtypes.
Table 2. Erector spinae muscle area values of the patients according to the T and M stage.
Table 3. Erector spinae muscle area values of the patients according to the histopathological subtypes.
Table 4. Post hoc analysis (Bonferroni) of ESMa measurements for histopathological subtypes.
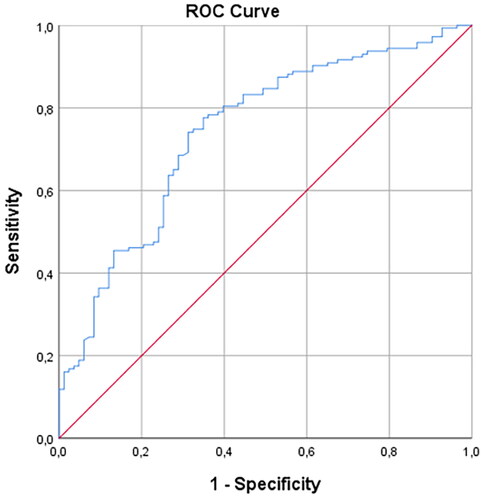
Figure 3. Receiver operating characteristic (ROC) curve of the ESMa for the differentiation between the metastatic and non-metastatic groups.
Data availability statement
The data that support the findings of this study are available from the corresponding author upon reasonable request.