
Figures & data
Figure 1. Weighted gene co-expression network analysis (WGCNA).
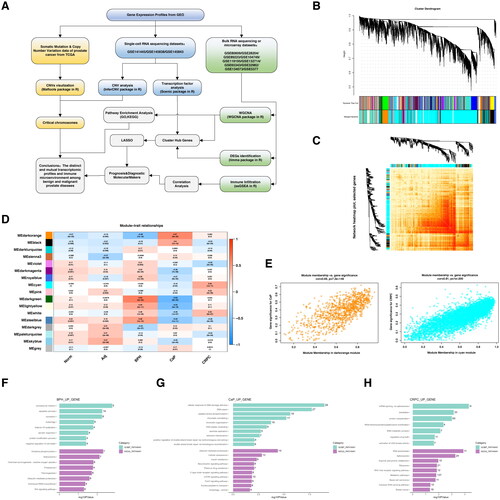
Figure 2. Analysis of copy number variations in benign prostate hyperplasia and prostate cancer.
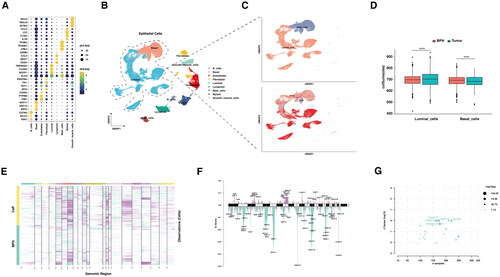
Figure 3. The difference in transcription factors between BPH and prostate cancer.
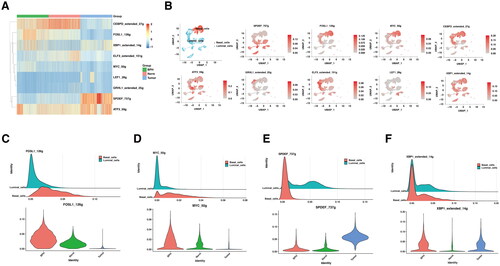
Figure 4. The unique gene signatures and signaling pathways in BPH.
PPI, protein–protein interaction; DEGs, differential expression of genes; BPH, benign prostate hyperplasia; CaP, prostate cancer; CRPC, castration-resistant prostate cancer; G.O., gene ontology.
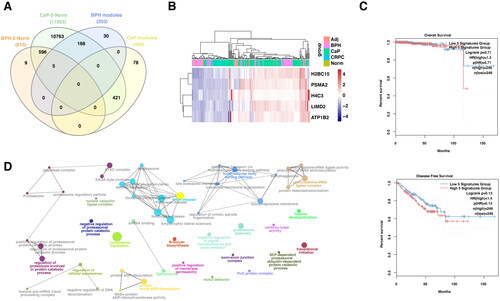
Figure 5. The role of mutual gene signatures between BPH and CRPC in prognosis and anti-PD1 response.
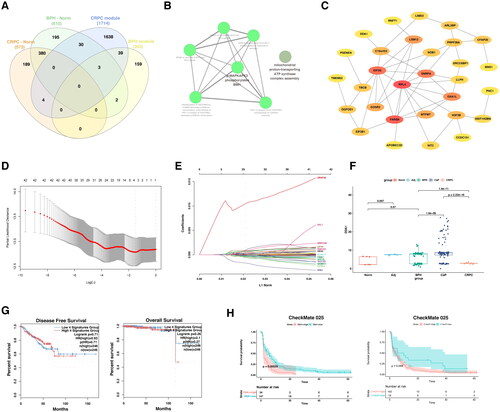
Figure 6. The comparison of immune microenvironment between BPH and CRPC.
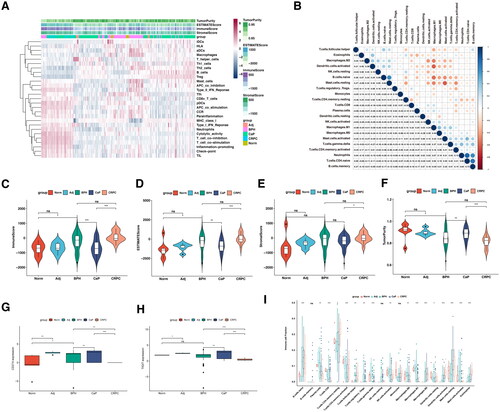
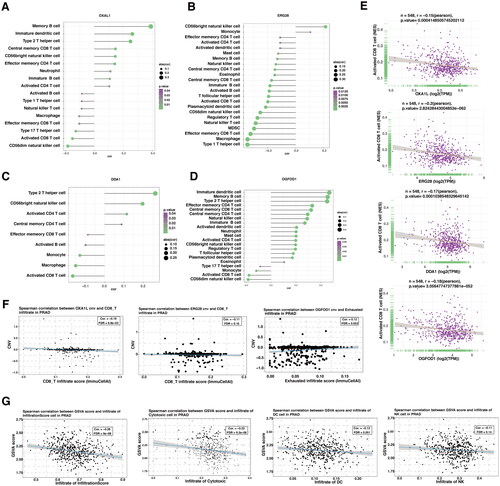
Figure 7. The correlation between selected gene signatures with the tumor immune microenvironment.
Supplemental Material
Download MS Word (3.8 MB)Supplemental Material
Download MS Excel (228.5 KB)Data availability statement
The original contributions presented in the study are included in the article/Supplementary Table S1, further inquiries can be directed to the corresponding author. All the scripts used in this study could be obtained by request to the corresponding author.