Figures & data
Table 1. The distribution of baseline characteristics, lifestyle behaviors, and health and life self-assessment for men aged 25–80 years, growing up in two types of families.
Table 2. Raw data of biological and physiological variables for men raised in complete and incomplete families.
Figure 1. The differences between the standardized mean values of the analyzed health parameters of men raised in complete and incomplete families.
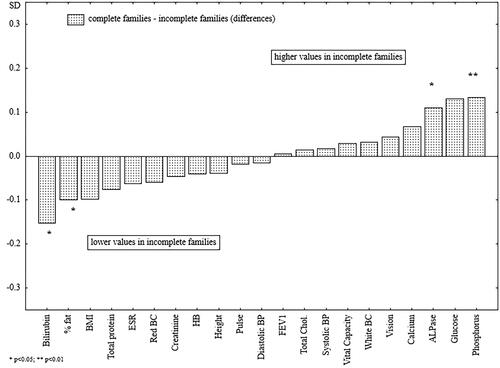
Figure 2. The differences between the standardized mean values of the analyzed health parameters of men raised in complete and single-parent families.
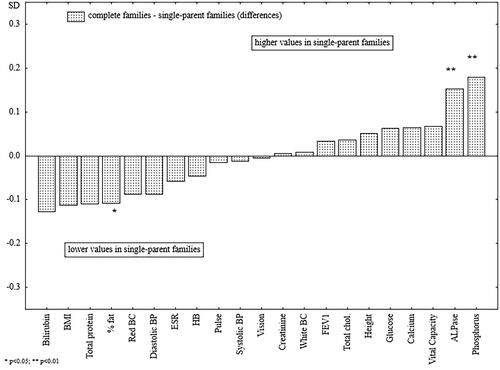
Figure 3. The differences between the standardized mean values of the analyzed health parameters of men raised in complete families and parentless men.
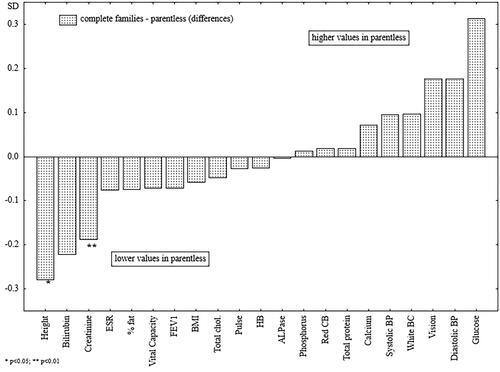
Figure 4. The differences between the standardized mean values of the analyzed health parameters of men raised in single-parent families and parentless men.
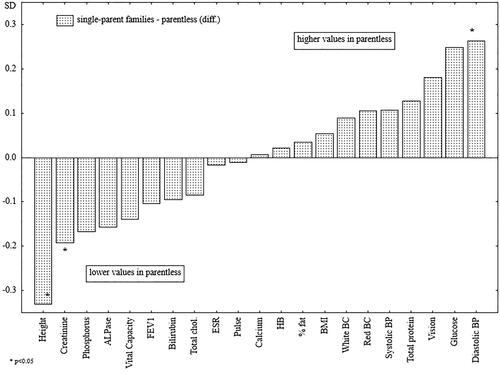
Figure 5. Standardized values of height of men raised in different types of families.
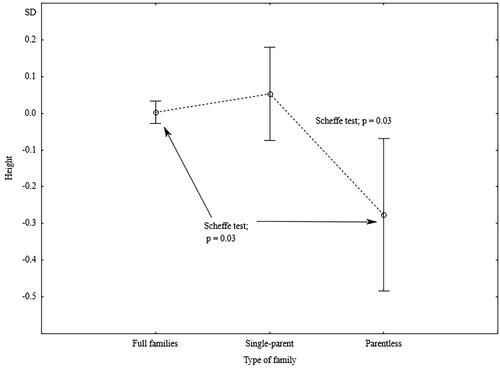
Table 3. The net effects of family type as a determinant of childhood SES status and current SES of adult men – results of two-way analyses of variance.
Figure 6. Standardized values of diastolic blood pressure of men raised in different types of families by current level of education.
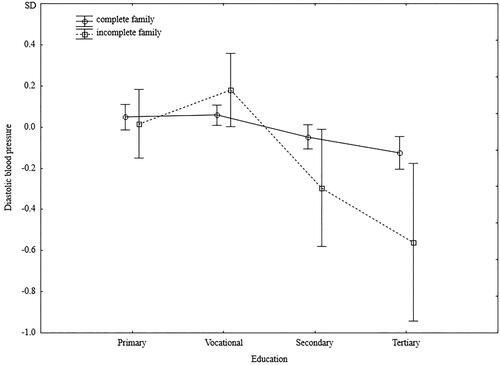
Figure 7. Standardized values of creatinine of men raised in different types of families by current level of education.
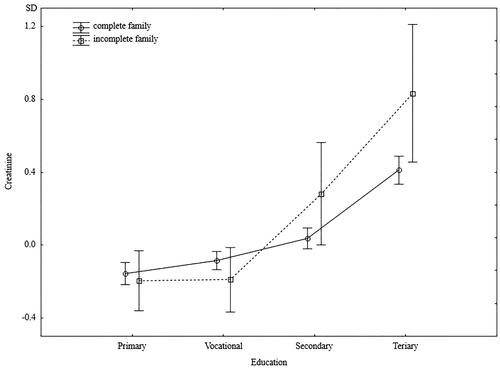
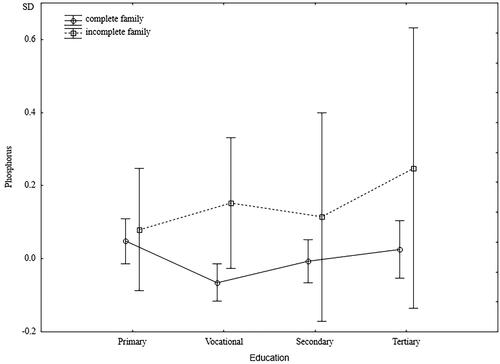
Figure 8. Standardized values of phosphorus of men raised in different types of families by current level of education.