
Figures & data
Figure 1. Experimental procedure of Mendelian randomization method applied to the causal relationship between JAK2 and prostate cancer.
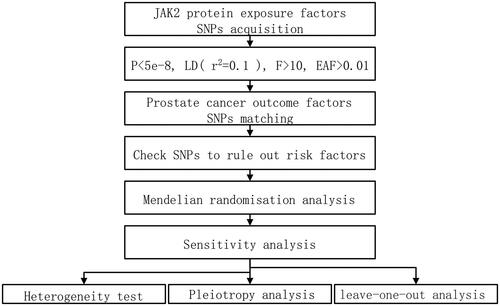
Figure 2. Forest plot of MR analysis of plasma protein JAK2 with PCa by IVW, weighted median, and MR Egger methods.
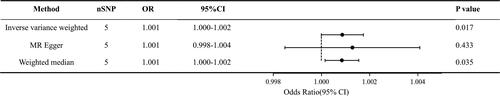
Figure 3. Scatter plot of MR analysis of plasma protein JAK2 with PCa by inverse variance weighted, weighted median, and MR Egger methods.
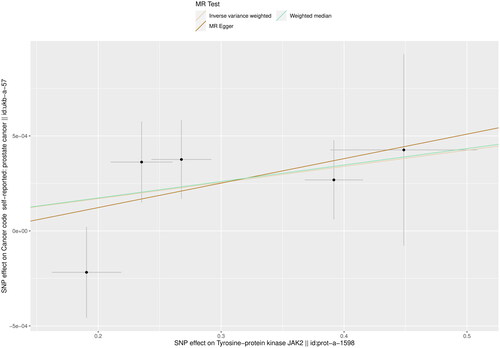
Figure 4. Funnel plot of inverse variance weighted, MR Egger’s multiple validity test for worker IVs, with the vertical line in the middle indicating the sum of different effect sizes.
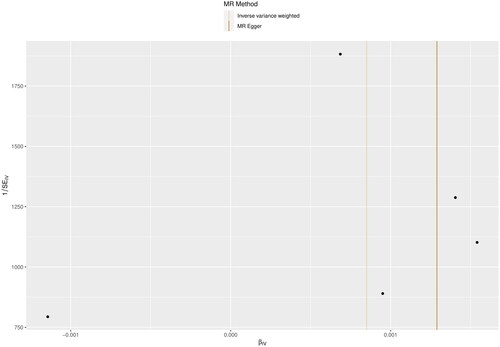
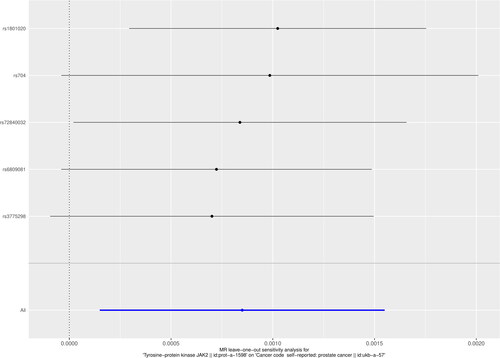
Figure 5. Effect of leave-one-out plot responses on the overall estimation of the causal effect of JAK2 on PCa by removing IVs one by one.
Data availability statement
All data can be found in the IEU OpenGWAS Project database (https://gwas.mrcieu.ac.uk/).