
Figures & data
Figure 1. PRISMA 2020 flow chart. This is a PRISMA 2020 flow chart. A total of 3160 articles were initially retrieved, of which 1729 were BP, 624 were FBG and 807 were TG. After screening, a total of 68 articles, including 30 BP, 18 FBG and 20 TG, were finally included in the meta-analysis.
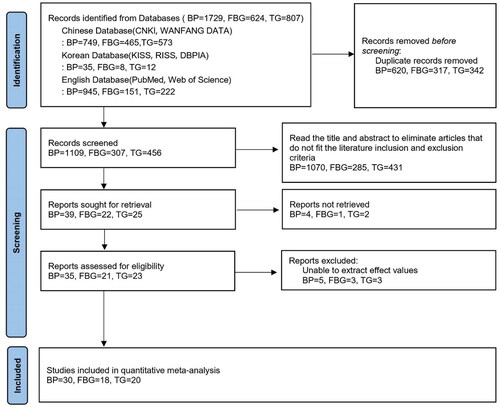
Table 1. Basic characteristics of included articles.
Figure 2. Results of the risk of bias. Judgments about each risk of bias item presented across all included trials.
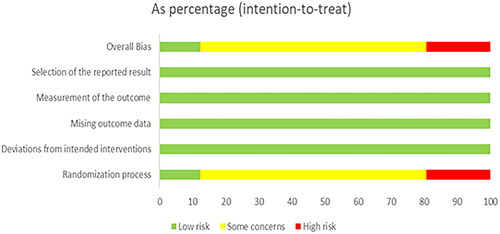
Figure 3. Results of the risk of bias. Judgments about each risk of bias item for each included trail.
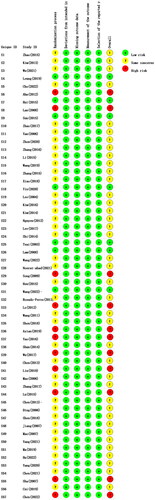
Table 2. Quantitative synthesis of main effects.
Figure 4. Forest plot of the sensitivity analysis of SBP. This is a Forest plot of the sensitivity analysis of SBP. Forest plots for all indicators show that the effect values were not significantly different from the main effects after the removal of any items.
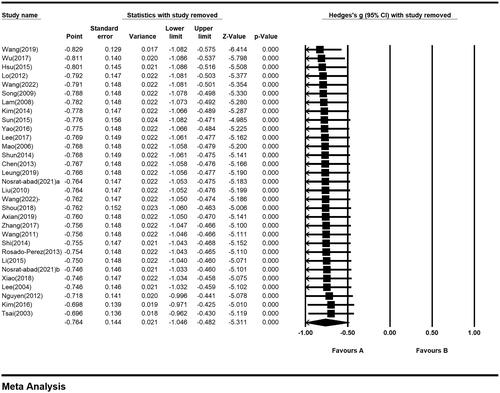
Figure 5. Forest plot of the sensitivity analysis of DBP. This is a Forest plot of the sensitivity analysis of DBP. Forest plots for all indicators show that the effect values were not significantly different from the main effects after the removal of any items.
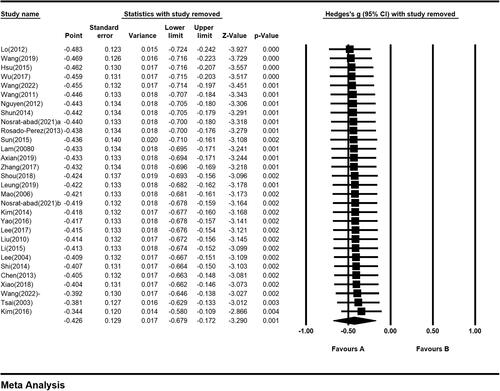
Figure 6. Forest plot of the sensitivity analysis of FBG. This is a Forest plot of the sensitivity analysis of FBG. Forest plots for all indicators show that the effect values were not significantly different from the main effects after the removal of any items.
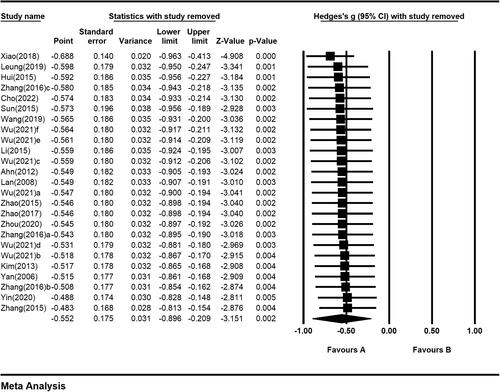
Figure 7. Forest plot of the sensitivity analysis of TG. This is a Forest plot of the sensitivity analysis of TG. Forest plots for all indicators show that the effect values were not significantly different from the main effects after the removal of any items.
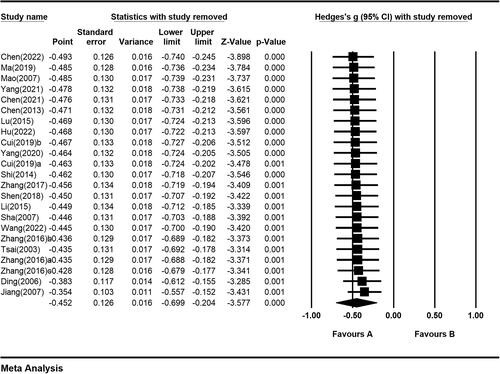
Table 3. Results of the sensitivity analysis.
Figure 8. Funnel plot. (A) Funnel plot of SBP. (B) Funnel plot of DBP. (C) Funnel plot of FBG. (D) Funnel plot of TG. This is a Funnel plot. The funnel plots for all indicators show good symmetry.
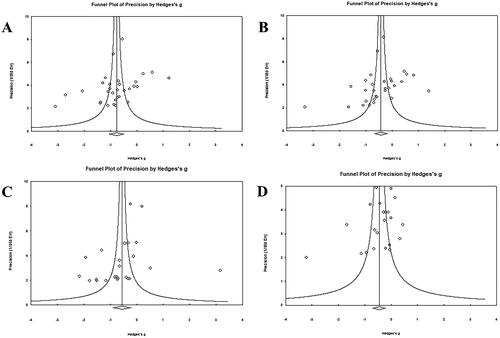
Table 4. Subgroup analysis of SBP.
Table 5. DBP subgroup analysis.
Table 6. FBG subgroup analysis.
Table 7. TG subgroup analysis.
Data availability statement
We are happy to provide raw data: https://www.dropbox.com/scl/fi/ud4ieq71bvelf8b987jl3/DATA.xls?dl=0&rlkey=p7vgdnugiv2km1e671t12prjd