
Figures & data
Figure 1. General flow chart of the study.
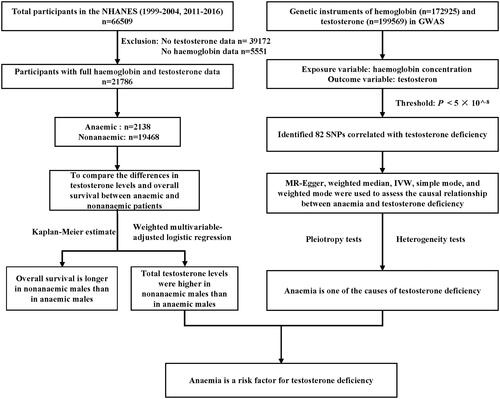
Table 1. Demographic and clinical characteristics of participants included in the NHANES.
Table 2. Causal relationships between anemia and testosterone deficiency: logistic regression.
Table 3. Results of regression analysis for anemia and testosterone levels after 5 imputations.
Table 4. Stratified analysis of testosterone levels in anemic and nonanemic patients.
Figure 2. Mendelian randomization reveals a causal relationship between anemia and testosterone deficiency. Hemoglobin as the exposure variable and total testosterone was used as the outcome variable. The results revealed greater testosterone levels in nonanemic individuals than in anemic individuals (p < 0.05 for MR–Egger, weighted median, inverse–variance weighting, and weighted mode).
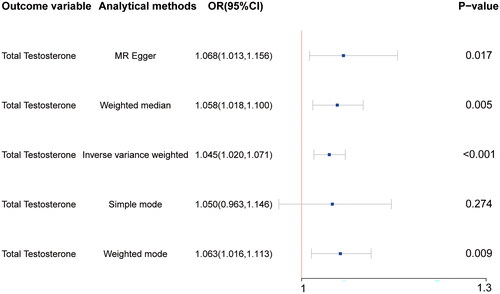
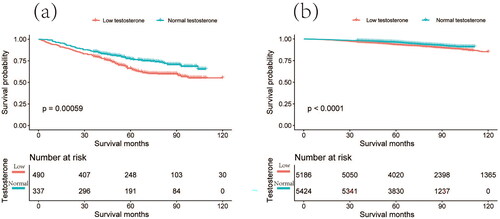
Figure 3. Kaplan–Meier survival analysis of testosterone levels differences between anemic and nonanemic patients. The red line represents individuals with testosterone deficiency, while the green line represents individuals with normal testosterone levels. (a) Kaplan–Meier survival plot comparing anemic patients with testosterone deficiency to anemic patients with normal testosterone levels. (b) Kaplan–Meier survival plot comparing nonanemic patients with testosterone deficiency to nonanemic patients with normal testosterone levels.
Supplemental Material
Download Zip (33.1 KB)Data availability statement
The data used in this study are available at the official websites of the NHANES (https://www.cdc.gov/nchs/nhanes/index.htm) and GWAS (https://gwas.mrcieu.ac.uk/) projects.