Figures & data
Figure 1. Individuals using the Internet (% of population). Source: World Development Indicators – World Bank. Compiled by authors.
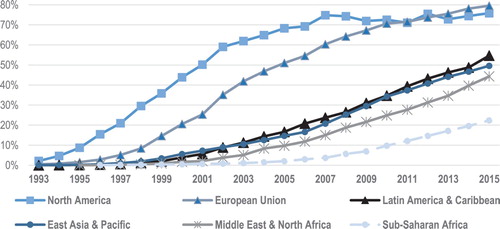
Figure 2. Percentage of US adults who use the Internet – 2012. Source: Zickuhr and Madden (Citation2012).
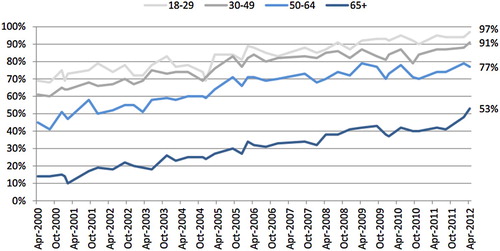
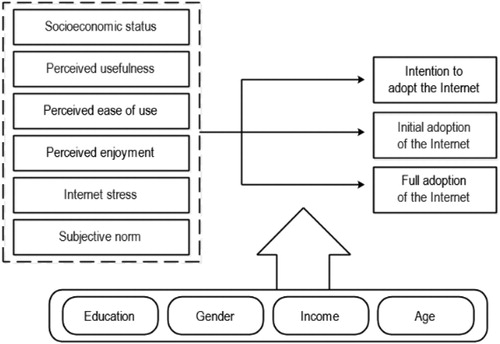
Figure 3. TAM model with sociodemographic variables. Source: Adapted from Lee et al. (Citation2014) and Niehaves and Plattfaut (Citation2014). Compiled by authors.