
Figures & data
Figure 1. Structure of the cohort Markov model.
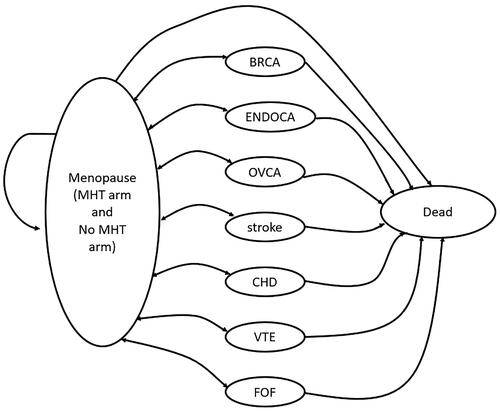
Table 1. Base case model parameters and references.
Figure 2. Tornado diagram of the univariate deterministic sensitivity analysis showing the variation in absolute ICER for parameters influencing the results more than one percent.
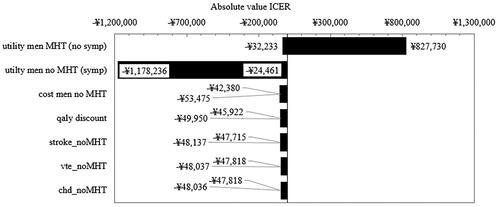
Table 2. Incremental cost utility results for deterministic range of scenarios.
Figure 3. Scatterplot of probabilistic sensitivity analysis (PSA) for 1,000 iterations of Monte Carlo simulation for the base case analysis (Yuan).
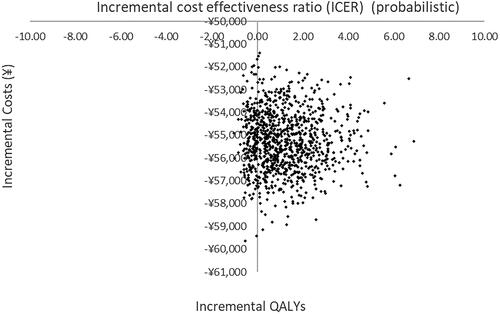
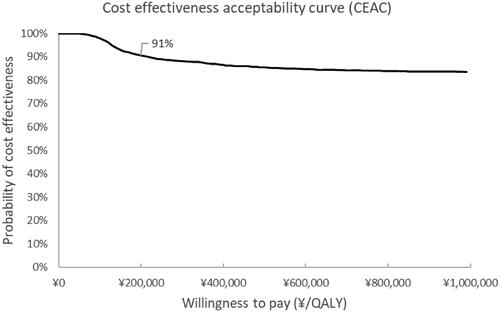
Figure 4. Cost effectiveness acceptability curve (CEAC) for 1,000 iterations of Monte Carlo simulation for the base case analysis (Yuan).
Supplemental material