Figures & data
Figure 1. Monthly healthcare utilization, proportion of patients, 6 months following index date: COVID-19 (January 2020–March 2021)* vs. controls (2018–2019)** [Adapted from: DeMartino, 2022Citation11]. Abbreviations. CDC, Centers for Disease Control and Prevention; ED, emergency department; ICD-10-CM, International Classification of Diseases 10th Revision, Clinical Modification. *Claims with COVID-19 diagnoses using the ICD-10-CM code U07.1, introduced on April 1, 2020. For claims between January 1, 2020, and March 31, 2020, ICD-10-CM code for “other coronavirus as the cause of diseases classified elsewhere” (B97.29) was used to identify patients with COVID-19, per CDC recommendations. Categories are not mutually exclusive; hence the sum of proportions may exceed 100%. The index date was the date of diagnosis. **Controls represent individuals who had no record of COVID-19, personal history of COVID-19, or pneumonia caused by COVID-19. The control group’s healthcare usage was analyzed during the year 2019, which was before the pandemic, and their index date was set as 1 year prior to the index date of their matched COVID-19 patient, i.e. the first observed diagnosis of COVID-19. Data presented are the proportion of patients with claims associated with hospitalization, intubation or ventilation, emergency department, outpatient visit, mental health visit, and/or rehabilitation. Absence of a colored segment denotes data was zero or negligibly small for that variable. For example, the segment for intubation or ventilator use appears missing because of extremely small values.
![Figure 1. Monthly healthcare utilization, proportion of patients, 6 months following index date: COVID-19 (January 2020–March 2021)* vs. controls (2018–2019)** [Adapted from: DeMartino, 2022Citation11]. Abbreviations. CDC, Centers for Disease Control and Prevention; ED, emergency department; ICD-10-CM, International Classification of Diseases 10th Revision, Clinical Modification. *Claims with COVID-19 diagnoses using the ICD-10-CM code U07.1, introduced on April 1, 2020. For claims between January 1, 2020, and March 31, 2020, ICD-10-CM code for “other coronavirus as the cause of diseases classified elsewhere” (B97.29) was used to identify patients with COVID-19, per CDC recommendations. Categories are not mutually exclusive; hence the sum of proportions may exceed 100%. The index date was the date of diagnosis. **Controls represent individuals who had no record of COVID-19, personal history of COVID-19, or pneumonia caused by COVID-19. The control group’s healthcare usage was analyzed during the year 2019, which was before the pandemic, and their index date was set as 1 year prior to the index date of their matched COVID-19 patient, i.e. the first observed diagnosis of COVID-19. Data presented are the proportion of patients with claims associated with hospitalization, intubation or ventilation, emergency department, outpatient visit, mental health visit, and/or rehabilitation. Absence of a colored segment denotes data was zero or negligibly small for that variable. For example, the segment for intubation or ventilator use appears missing because of extremely small values.](/cms/asset/bb0cad40-7ce1-4a5e-95a6-36e4884b88c1/ijme_a_2309835_f0001_c.jpg)
Figure 2. Total average number of week-long health-related absences (March 2020 to December 2021) per 1,000 employed workers.Citation20 Average number of absences per 1,000 employed workers. Duration of absence is unknown.
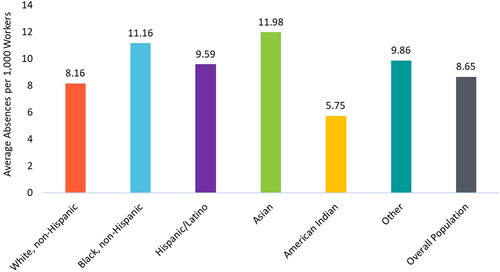
Figure 3. Paid leave costs and lost wages for employers resulting from illness due to COVID-19 (in billions).Citation5 Employee benefits include health insurance, retirement, unemployment, etc. Disability insurance payments are specific to California and New York. Total represents the sum of all the categories above.
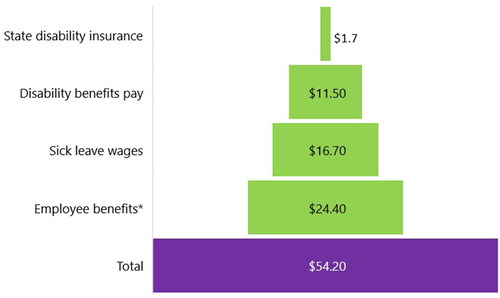
Figure 4. Ability to work from home some or all of the time, private US establishments, 2022. Data derived from a 2022 Bureau of Labor Statistics report.Citation23
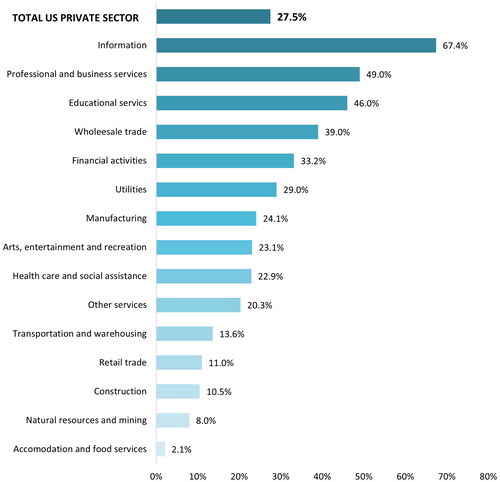
Figure 5. Mean Work Productivity and Activity Impairment questionnaire scores by vaccination status: general health due to COVID-19 (%) (Adapted from DiFusco, 2022Citation32)
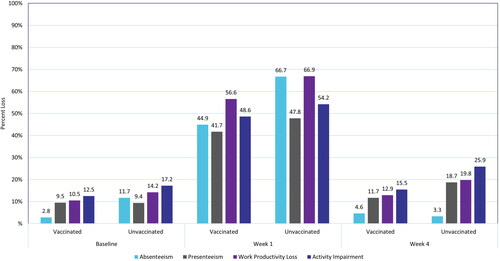
Figure 6. COVID-19-related mortality (per 100,000 workers) among selected occupations in California (2020).Citation34 Nine select occupational groups with mortality rates higher than the overall of 30 per 100,000 along with values for healthcare support workers. Healthcare Support included the following occupations: nursing, psychiatric, and home health aides; occupational therapy assistants and aides; physical therapist assistants and aides; massage therapists; dental assistants; medical assistants; medical transcriptionists; pharmacy aides; veterinary assistants and laboratory animal caretakers; phlebotomists; and miscellaneous healthcare support occupations, including medical equipment preparers.
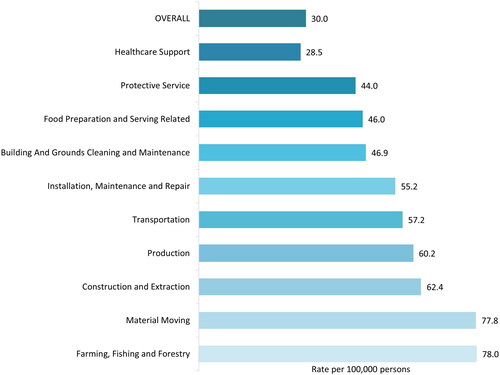
Figure 7. Age-adjusted COVID-19 mortality (per 100,000 workers) by race/ethnicity in healthcare workers among working Californians in 2020.Citation34 Healthcare support included the following occupations: nursing, psychiatric, and home health aides; occupational therapy assistants and aides; physical therapist assistants and aides; massage therapists; dental assistants; medical assistants; medical transcriptionists; pharmacy aides; veterinary assistants and laboratory animal caretakers; phlebotomists; and miscellaneous healthcare support occupations, including medical equipment preparers.
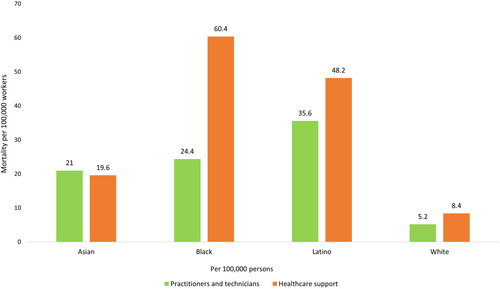
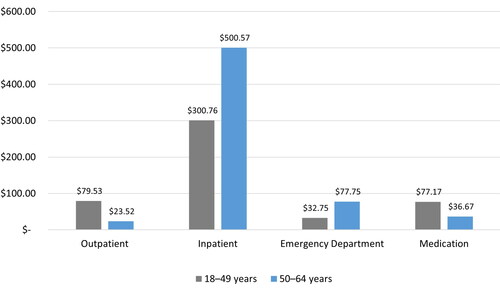
Figure 8. Impact of flu on total medical costs by age from Putri 2018Citation43 (millions of $).