Figures & data
Figure 1. Discrete choice experiment grid.
The attributes and attribute levels depicted in the grid were shown to respondents in the discrete choice experiment to assess overall preference for treatment and preference for adherence and compliance. A = Attribute 4, Level 2 not shown with Attribute 5, Level 3 due to incompatibility.
*Weight requirement describes restrictions for product use based on patient weight.
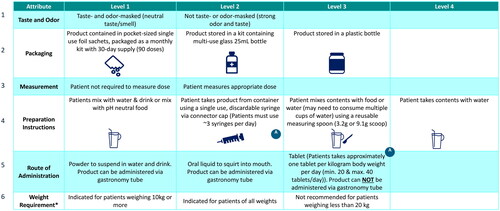
Table 1. Health care provider demographics and practice setting characteristics.
Figure 2. Product attribute importance rating reported by health care providers.
Respondents were asked to rate the importance of the indicated product attributes for the selection of a nitrogen-binding medication treatment for UCDs using a 9-point Likert scale. Attributes rated on 1–9 scale; 1 = not at all important; 9 = extremely important; error bars show one standard deviation.
Abbreviation. UCD, urea cycle disorder.
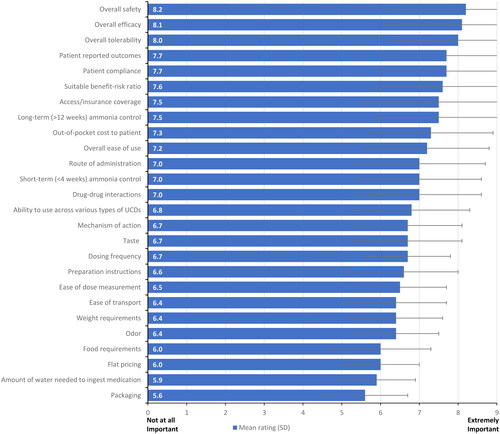
Figure 3. Disease state attitudes reported by health care providers.
Respondents were asked to rate their agreement with the indicated statements regarding existing nitrogen-binding medications for UCDs using a 9-point Likert scale. Attributes rated on 1–9 scale; 1 = strongly disagree; 9 = strongly agree; error bars show one standard deviation.
Abbreviation. UCD, urea cycle disorder.
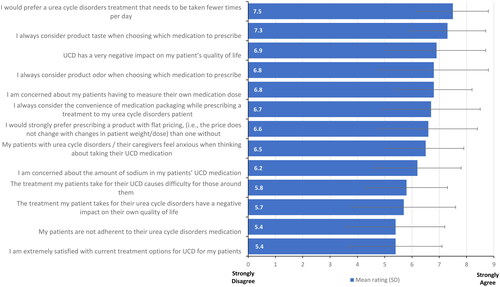
Figure 4. Drivers of product overall preference and product adherence and compliance.
The bar graph shows the results from the discrete choice experiment for overall preference and adherence and compliance by attribute. The dotted line represents the level anticipated if all attributes were of equal importance (i.e., 100 divided by the number of attributes).
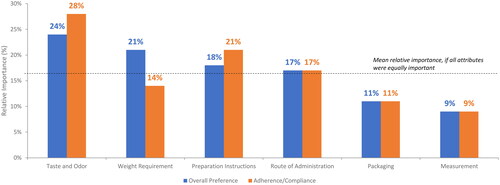
Figure 5. Mean relative preference weights for overall treatment preference.
The chart shows the results from the discrete choice experiment for levels within each attribute for overall preference. Attributes are found along the x-axis, relative preference weights are on the y-axis, and colored dots show relative preference weights for specific attribute levels. The green gradient background reflects the overall importance of the attributes, with attributes ordered from most important to least important, left to right (see also ).
*In the context of individual attribute levels, attribute refers to weight restrictions rather than weight-based dosing.
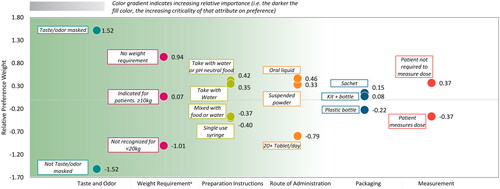
Figure 6. Mean relative preference weights for treatment adherence and compliance.
The chart shows the results from the discrete choice experiment for levels within each attribute for treatment adherence and compliance. Attributes are found along the x-axis, relative preference weights are on the y-axis, and colored dots show relative preference weights for specific attribute levels. The green gradient background reflects the overall importance of the attributes, with attributes ordered from most important to least important, left to right (see also ).
*In the context of individual attribute levels, attribute refers to weight restrictions rather than weight-based dosing.
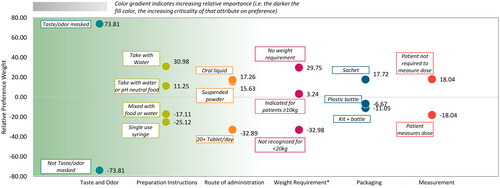
Figure 7. Composite of the normalized preference weights (preference-based utilities*) for overall treatment preference and treatment adherence and compliance.
The figure shows four product profiles for overall preference and adherence and compliance preference, based on the sum of normalized attribute level preference weights across six key attributes as indicated by the figure legend, including: taste and odor; preparation instructions; route of administration; weight requirement; packaging, and measurement. An ideal product would have a composite of normalized preference weights of 100%. Profiles that are statistically significantly different (α < 0.05) are labeled with the letter of the comparator.
*Sum of all utilities for each treatment’s corresponding level per attribute, out of a hypothetical 100% representing an ideal product.
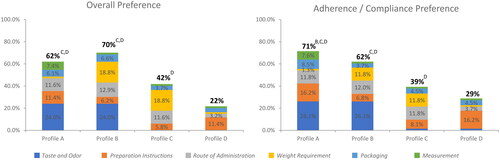
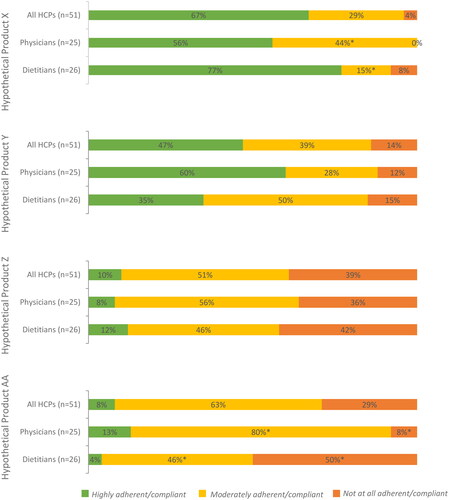
Figure 8. Static product profile ratings.
Respondents were asked to rate the importance the indicated product attributes of hypothetical nitrogen-binding medication treatments (see Supplemental Table 2 for profiles) for UCDs using a 9-point Likert scale.
XStatistically significantly different from product profile X at an α level of 0.05.
YStatistically significantly different from product profile Y at an α level of 0.05.
ZStatistically significantly different from product profile Z at an α level of 0.05.
AAStatistically significantly different from product profile AA at an α level of 0.05.
*In the context of individual attribute levels, attribute refers to weight restrictions rather than weight-based dosing.
Abbreviation. UCD, urea cycle disorder.
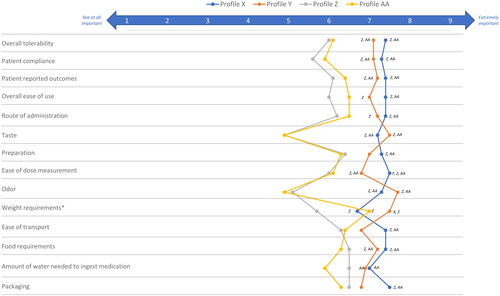
Figure 9. Most preferred UCD treatment by health care provider type.
Respondents were asked to indicate their overall preference for a hypothetical nitrogen-binding medication treatment (see Supplemental Table 2 for profiles) for UCDs using a 9-point Likert scale.
Abbreviation. UCD, urea cycle disorder.
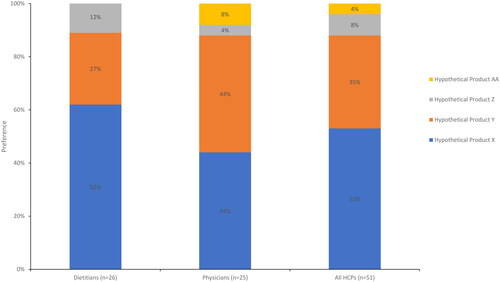
Figure 10. Expected level of adherence of UCD treatment by health care provider type.
Respondents were asked to indicate the anticipated patient adherence and compliance with each hypothetical nitrogen-binding medication treatment (see Supplemental Table 2 for profiles) for UCDs.
*Significant at α level of 0.05.
Abbreviation. UCD, urea cycle disorder.