
Figures & data
Figure 1. Study design. ADHD, attention-deficit/hyperactivity disorder.
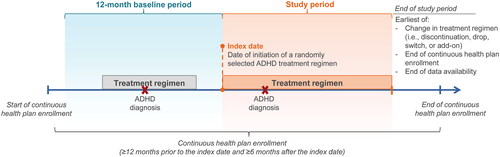
Figure 2. Sample selection flow chart. ADHD, attention-deficit/hyperactivity disorder; FDA, Food and Drug Administration; ICD-10-CM, International Classification of Diseases, Tenth Revision, Clinical Modification. 1ADHD was defined as ICD-10-CM codes: F90.x. 2Patients could have initiated more than one treatment (i.e., multiple candidate index dates).
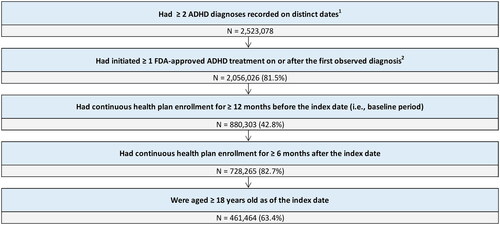
Figure 3. Prevalence of AEs during the study period. AE, adverse event. 1AEs were identified based on recorded diagnosis on a medical claim; prevalence was estimated from the proportion of patients with a diagnosis for a given AE recorded on a medical claim during their index treatment episode.
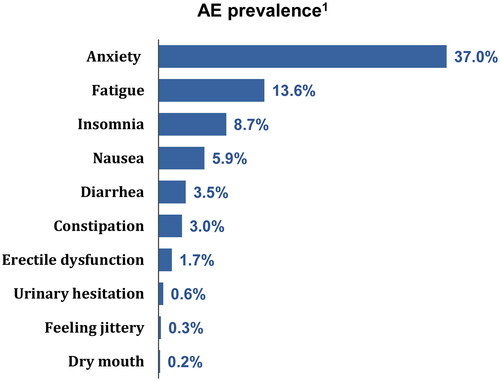
Table 1. Patient characteristics.
Figure 4. Incremental healthcare costs in the AE cohort compared to AE-free cohort. AE, adverse event; PPPM, per-patient-per-month. 1All cost differences were statistically significant at the 5% confidence level.
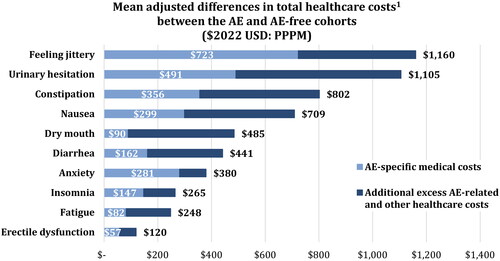
Figure 5. Estimated annual incremental healthcare costs associated with AEs per 1 million adults. AE, adverse event. 1Assuming 4.4% prevalence of ADHD (based on Kessler et al.Citation3); the proportion of treated patients and AE prevalence are based on findings from the current study. AE-specific medical costs were defined based on a medical claim with a recorded diagnosis for that given AE.
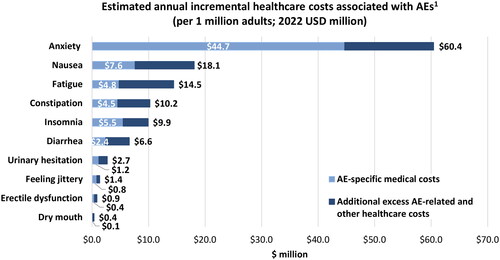
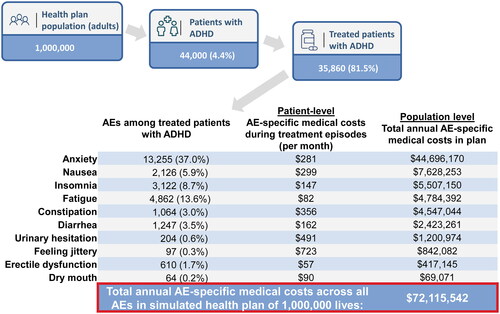
Figure 6. Estimated annual AE-specific medical costs in a hypothetical health plan with 1 million members. ADHD, attention-deficit and hyperactivity disorder; AE, adverse event. 1AE prevalence was estimated from the proportion of patients with a diagnosis for a given AE recorded on a medical claim during their index treatment episode (based on total sample of 461,464 patients). An ADHD prevalence of 4.4% was assumed based on Kessler et al.3, and the proportion of treated patients was based on findings from the current study. 2Calculations are based on all AE-specific medical costs being independent – i.e. no more than one AE is recorded on an individual claim – and AEs lasting for the entire 12-month period.
Supplemental Material
Download MS Word (89.9 KB)Data availability statement
The data that support the findings of this study are available from PharMetrics Plus, but restrictions apply to the availability of these data, which were used under license for the current study, and so are not publicly available.