
Figures & data
Figure 1. Flow chart of participants included in the study. E2, 17β-estradiol; ITT, intention-to-treat; NETA, norethisterone acetate; PP, per protocol.
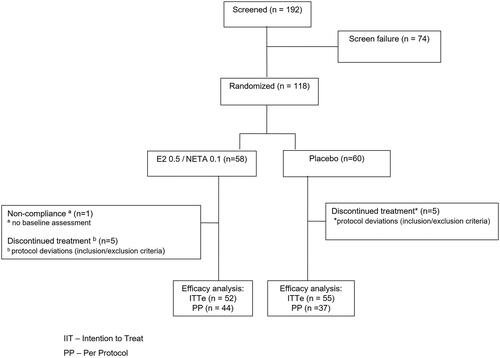
Table 1. Demographic and clinical baseline characteristics of participants according to treatment group.
Figure 2. Number of hot flushes per week before and at the end of treatment (intention-to-treat [ITT] analysis population). 17β-E2, 17β-estradiol; NETA, norethisterone acetate.
![Figure 2. Number of hot flushes per week before and at the end of treatment (intention-to-treat [ITT] analysis population). 17β-E2, 17β-estradiol; NETA, norethisterone acetate.](/cms/asset/59242b19-7c7e-4f21-9dfa-9192ef16956e/icmt_a_2190507_f0002_b.jpg)
Figure 3. Mean number of hot flushes by week in both groups (0.5 mg 17β-estradiol [17β-E2]/0.1 mg norethisterone acetate [NETA] and placebo group). Intention-to-treat (ITT) analysis population.
![Figure 3. Mean number of hot flushes by week in both groups (0.5 mg 17β-estradiol [17β-E2]/0.1 mg norethisterone acetate [NETA] and placebo group). Intention-to-treat (ITT) analysis population.](/cms/asset/5e1c45de-5844-479b-a94b-e501b07f80c9/icmt_a_2190507_f0003_b.jpg)
Figure 4. Percentage change of hot flush weekly weighted score (HFWWS) at weeks 4, 8, 12 and 24 of treatment compared to baseline. Intention-to-treat (ITT) analysis population. HFWWS = (mild hot flushes × 1) + (moderate hot flushes × 2) + (severe hot flushes × 3). 17β-E2, 17β-estradiol; NETA, norethisterone acetate.
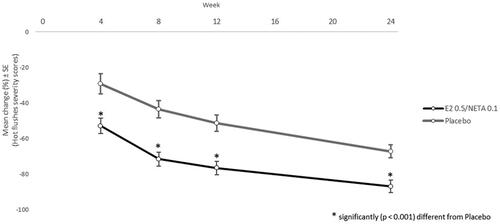
Table 2. Severity score of vasomotor symptoms before and at end of treatment (intention-to-treat [ITT] analysis population): hot flush weekly weighted score.