
Figures & data
Figure 1. Test Battery in chronological order of administration. NVA = normal visual acuity; LVA = low visual acuity; DART = Dutch Adult Reading Test; MMSE = Mini Mental State Examination; TMT = Trail Making Test; VOSP = Visual Object and Space Perception Battery.
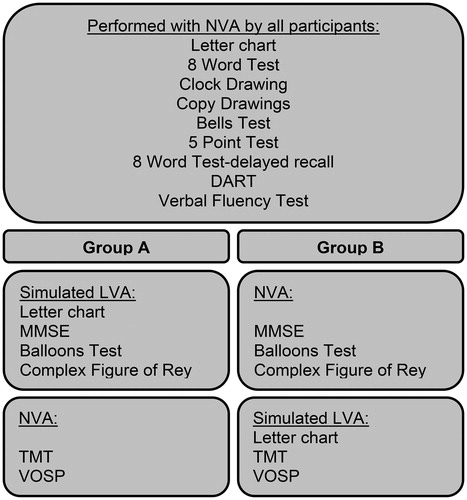
Table 1. Summary of participant characteristics, visual acuity, and scores on neuropsychological tests that all participants performed with normal or corrected to normal visual acuity.
Table 2. Summary of scores on neuropsychological tests.
Table 3. Chances of scoring below the cutoff value.
Figure 2. Predicted scores on the Trail Making Test part A for ages 55, 65, and 75 based on the regression model. NVA = normal visual acuity; LVA = low visual acuity; TMT-A = Trail Making Test part A.
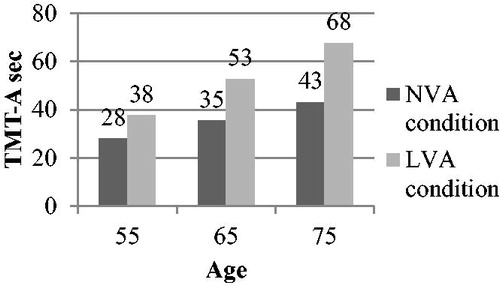
Figure 3. Predicted scores on the Trail Making Test part B for ages 55, 65, and 75 based on the regression model. NVA = normal visual acuity; LVA = low visual acuity; TMT-B = Trail Making Test part B.
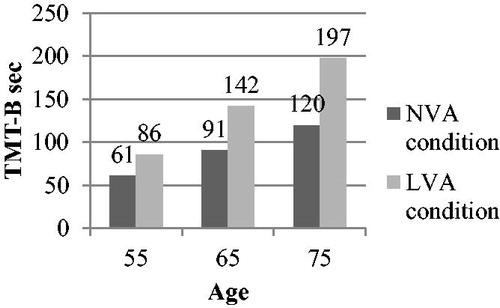
Figure 4. Predicted scores on the Visual Object and Space Perception Battery subtest 3 for ages 55, 65, and 75 based on the regression model. NVA = normal visual acuity; LVA = low visual acuity; VOSP-3 = Visual Object and Space Perception Battery subtest 3.
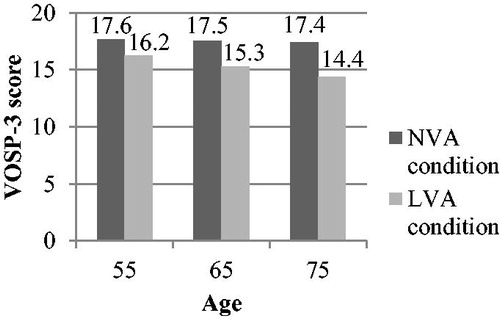
Table 4. Regression output for the total group (n = 238). Age, vision condition, and age × vision condition entered as independent variables.