Figures & data
Figure 1 Effect of different fractions of S. reticulata. on % variation of fasting blood glucose levels of alloxan diabetic rats. Rats were administered a relevant dosage of fractions dissolved in 2% methyl cellulose or just 2% methyl cellulose for the control. Serum glucose levels were monitored at 1 h intervals for Each point is a mean of six determinants ±SEM. When examined by Student's t.-test, significantly different from control values. * p < 0.01, ** p < 0.001.
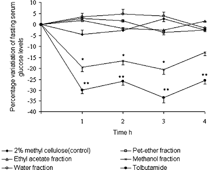
Figure 2 Effects of different fractions of S. reticulata. on an oral glucose tolerance test in alloxan diabetic rats. The bars represent the area under-the-curve of blood glucose levels in oral glucose tolerance tests (OGTT). Rats were administered a relevant dosage of fractions dissolved in 2% methyl cellulose or 2% methyl cellulose. Oral glucose load (10 ml/kg, 50% w/v) was given 15 min after the administration of each fraction. Serum glucose levels were monitored at 1 h intervals for 4 h. Each point is a mean of six determinants ±SEM. When examined by Student's t.-test, significantly different from control values. * p < 0.01, ** p < 0.001.
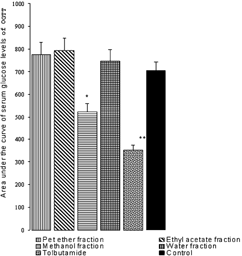
Figure 3 Effect of long-term treatment (120 days) with precipitate from methanol fraction of S. reticulata. on body weight, water and food intake, fructoseamine levels, and percentage variation of fasting blood glucose levels in alloxan diabetic rats. Precipitate from methanol fraction (175 mg kg−1) was administered twice a day to diabetic treated group (-O-) and the same volume of distilled water to the diabetic untreated group (-□-) for 120 days. A third group of healthy rats (-▴-) matched for age and sex receiving same amount of distilled water served as control group. The body weight and food and water intake of rats were monitored daily. Fasting blood glucose levels were measured on the 14th, 75th, 35th, 50th, and 120th days while fructoseamine levels were measured on the 50th, 75th, and 120th days after commencement of the experiment. Each line is a power regression and each point is a mean of 10 determinations ±SEM. *** p < 0.001, ** p < 0.01, * p < 0.05 compared with diabetic control group.
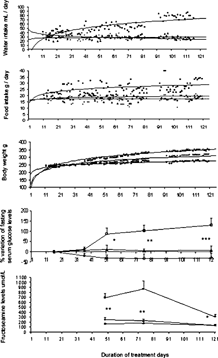
Table 1.. Effect of long-term treatment with methanol extracts (350 mg kg−1) of Salacia reticulata. on serum insulin and glycosylated hemoglobin levels