Figures & data
Table 1. Statistical analysis of the content of carnosic acid (CA), carnosol (CAR), and rosmarinic acid (RA) and DPPH radical-scavenging activity of crude methanolic extracts of in vitro. shoot culture, differentiated callus, and cell suspension of Rosmarinus officinalis. “hanging” measured during study period as shown in , , and .
Figure 2 Changes in the content of phenolic antioxidant compounds and in DPPH radical-scavenging activity in in vitro. shoot cultures of Rosmarinus officinalis. “hanging” over a period of 17 months [each value is the mean of two (CA, CAR, RA) or three (DPPH) measurements].
![Figure 2 Changes in the content of phenolic antioxidant compounds and in DPPH radical-scavenging activity in in vitro. shoot cultures of Rosmarinus officinalis. “hanging” over a period of 17 months [each value is the mean of two (CA, CAR, RA) or three (DPPH) measurements].](/cms/asset/6888f6da-fc0f-4a77-9dd2-0450428698ba/iphb_a_179353_f0002_b.gif)
Figure 3 Changes in the content of phenolic antioxidant compounds and in DPPH radical-scavenging activity in differentiated callus cultures of Rosmarinus officinalis. “hanging” over a period of 10 months [each value is the mean of two (CA, CAR, RA) or three (DPPH) measurements].
![Figure 3 Changes in the content of phenolic antioxidant compounds and in DPPH radical-scavenging activity in differentiated callus cultures of Rosmarinus officinalis. “hanging” over a period of 10 months [each value is the mean of two (CA, CAR, RA) or three (DPPH) measurements].](/cms/asset/da083098-5b87-46d5-af13-ad8099d10dee/iphb_a_179353_f0003_b.gif)
Figure 4 Changes in the content of phenolic antioxidant compounds and in DPPH radical-scavenging activity in suspension culture of Rosmarinus officinalis. “hanging” over a period of 14 months [each value is the mean of two (CA, CAR, RA) or three (DPPH) measurements].
![Figure 4 Changes in the content of phenolic antioxidant compounds and in DPPH radical-scavenging activity in suspension culture of Rosmarinus officinalis. “hanging” over a period of 14 months [each value is the mean of two (CA, CAR, RA) or three (DPPH) measurements].](/cms/asset/c48e0bac-d53e-4950-b4c9-84d8543ee041/iphb_a_179353_f0004_b.gif)
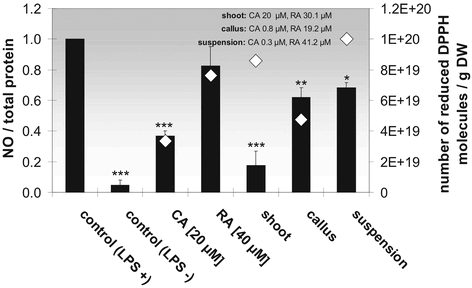
Figure 7 Anti-inflammatory (black bars) and antioxidative (white diamonds) effect of the pure phytochemicals carnosic acid (CA) and rosmarinic acid (RA) and of rosemary cell culture extracts deriving from cell cultures with different differentiation degrees that decreases in the order shoot, differentiated callus, and suspension culture, on LPS-stimulated microglial cells. Each bar/diamond represents the mean ± SE of three independent experiments. ***p < 0.001, **p < 0.01, *p < 0.05 versus control + LPS (ANOVA followed by Bonferroni test).

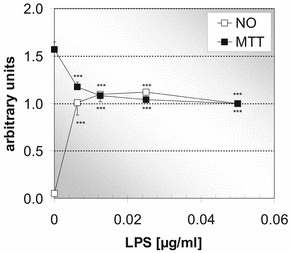
Figure 5 Effect of different concentrations of the inflammogen LPS on formazan formation (MTT assay) and NO production by microglial cells. A maximal microglia activation is reached at 0.0125 µg/ml LPS (24 h of incubation). MTT assay (black squares), NO measurement (white squares). Each point represents the mean ± SE of three independent experiments. ***p < 0.001 versus 0 µM carnosic acid (ANOVA followed by Bonferroni test).

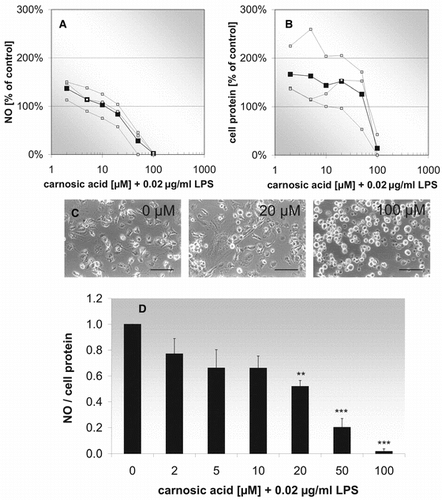
Figure 6 Effect of carnosic acid (different concentrations) and LPS (0.02 µg/ml) on NO formation (A), cell protein (B), morphology (C), and NO/cell protein-ratio (D). (A, B) Concentration-effect relationship. The curve with black squares represents the mean of three independent experiments (white squares). (C) Phase-contrast micrographs of treated microglia in culture. Scale bar: 90 µm. (D) Histogramm for the concentration-effect relationship. Each bar represents the mean ± SE of three independent experiments. ***p < 0.001, **p < 0.01 versus 0 µM carnosic acid (ANOVA followed by Bonferroni test).

