362
Views
1
CrossRef citations to date
0
Altmetric
Research Article

Intrarectal Dehydroleucodine Suppresses Trinitrobenzene Sulfonic Acid–Induced Colitis in Rats, A Model for Inflammatory Bowel Disease

, , , , , , & show all
Pages 316-323 | Accepted 21 Nov 2006, Published online: 07 Oct 2008

Figures & data

Figure 1 Structure of dehydroleucodine, isolated from Artemisia douglasiana..

Figure 1 Structure of dehydroleucodine, isolated from Artemisia douglasiana..

Table 1.. Criteria for macroscopic scoring of colonic ulceration and inflammation.

Figure 2 Effect of DhL on area and severity of the colonic lesions induced in the rat and lesion area. Data show the mean values and the SEM of eight rats in each group. *p. < 0.05, **p. < 0.001 versus TNBS.
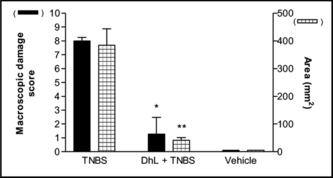
Figure 2 Effect of DhL on area and severity of the colonic lesions induced in the rat and lesion area. Data show the mean values and the SEM of eight rats in each group. *p. < 0.05, **p. < 0.001 versus TNBS.

Figure 3 Effect of DhL on body weight gain and diarrhea. Data show the mean values and the SEM of the eight rats in each group. *p. < 0.001 versus TNBS.
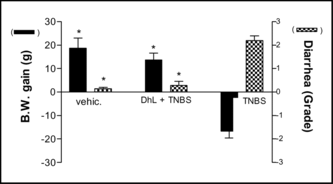
Figure 3 Effect of DhL on body weight gain and diarrhea. Data show the mean values and the SEM of the eight rats in each group. *p. < 0.001 versus TNBS.

Figure 4 Colonic weight of the TNBS control group and the DhL group. Data show the mean values and the SEM of the eight rats in each group. *p.<0.05 versus TNBS.
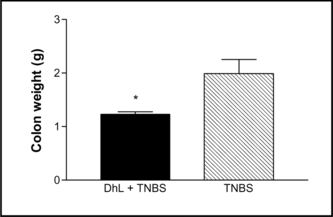
Figure 4 Colonic weight of the TNBS control group and the DhL group. Data show the mean values and the SEM of the eight rats in each group. *p.<0.05 versus TNBS.

Figure 5 Micrograph of rat colon mucosa showing dilated and fused crypts with intraluminal mucus content (arrowhead) in TNBS-group. Note PMN and lymphocyte infiltration. PAS-hematoxylin, × 100.
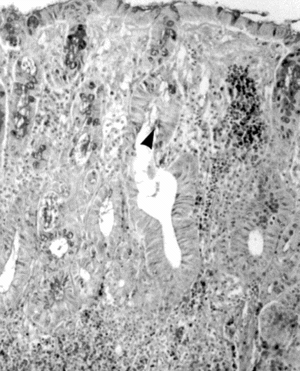
Figure 5 Micrograph of rat colon mucosa showing dilated and fused crypts with intraluminal mucus content (arrowhead) in TNBS-group. Note PMN and lymphocyte infiltration. PAS-hematoxylin, × 100.

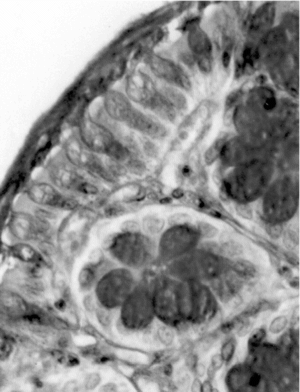
Figure 6 Micrograph of rat colon mucosa of TNBS group. Dilated crypts (★); mitosis (arrowhead). PAS-hematoxylin, × 250.
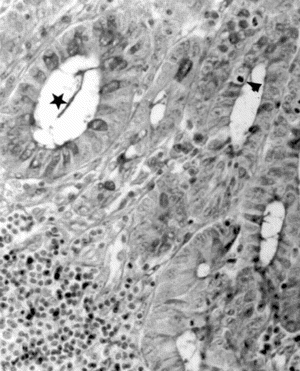
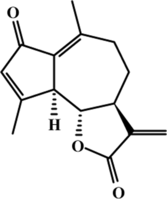
Figure 6 Micrograph of rat colon mucosa of TNBS group. Dilated crypts (★); mitosis (arrowhead). PAS-hematoxylin, × 250.
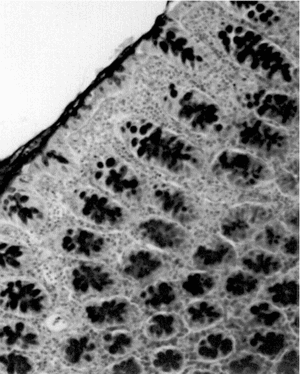
Figure 7 Micrograph of rat colon mucosa of DhL group. Note abundant PAS + material in the crypts and ephitelial surface. PAS-hematoxylin, × 100.

Figure 7 Micrograph of rat colon mucosa of DhL group. Note abundant PAS + material in the crypts and ephitelial surface. PAS-hematoxylin, × 100.

Figure 8 Paraffin section of colonic mucosa of DhL group rat. Note epithelial surface with PAS + material. PAS-hematoxylin, × 400.

Figure 8 Paraffin section of colonic mucosa of DhL group rat. Note epithelial surface with PAS + material. PAS-hematoxylin, × 400.

Reprints and Corporate Permissions

Please note: Selecting permissions does not provide access to the full text of the article, please see our help page How do I view content?

To request a reprint or corporate permissions for this article, please click on the relevant link below:

Academic Permissions

Please note: Selecting permissions does not provide access to the full text of the article, please see our help page How do I view content?

Obtain permissions instantly via Rightslink by clicking on the button below:

If you are unable to obtain permissions via Rightslink, please complete and submit this Permissions form. For more information, please visit our Permissions help page.