1,187
Views
4
CrossRef citations to date
0
Altmetric
Research Article

Tribulus terrestris. Fruit Extract Protects Against Oxidative Stress-Induced Apoptosis

, &
Pages 619-625 | Accepted 14 May 2007, Published online: 07 Oct 2008

Figures & data

Figure 1 Tribulus terrestris. extract inhibited both radiation- as well as AAPH-induced intracellular ROS. Spleen cells were labeled with H2DCFDA and exposed to either γ-radiation or AAPH in presence of different concentrations of TTE. The increase in intracellular fluorescence of cells was measured by flow cytometry after their treatment. (a) TTE only, (b) TTE immediately followed by exposure to a dose of 2 Gy γ radiation, (c) TTE immediately followed by exposure to 250 µM AAPH. The results are expressed as the average median fluorescence intensity ± SE for three replicates. Representative data from one of the three similar experiments are shown.
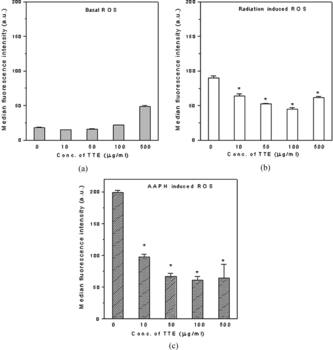
Figure 1 Tribulus terrestris. extract inhibited both radiation- as well as AAPH-induced intracellular ROS. Spleen cells were labeled with H2DCFDA and exposed to either γ-radiation or AAPH in presence of different concentrations of TTE. The increase in intracellular fluorescence of cells was measured by flow cytometry after their treatment. (a) TTE only, (b) TTE immediately followed by exposure to a dose of 2 Gy γ radiation, (c) TTE immediately followed by exposure to 250 µM AAPH. The results are expressed as the average median fluorescence intensity ± SE for three replicates. Representative data from one of the three similar experiments are shown.

Figure 2 Presence of TTE during induction of oxidative stress was required for optimal protection against intracellular ROS. Cells treated with TTE for 1 h were subsequently exposed to (a) a dose of 2 Gy γ radiation, (b) 250 µM AAPH. All the samples were taken in triplicate, and the average median fluorescence intensity is expressed as the percent change over the control value. Open bars indicate ROS in cells exposed to 2 Gy in the presence of TTE. Closed bars indicate ROS in cells exposed to 2 Gy after removal of TTE. Data from one of the three similar experiments are shown.
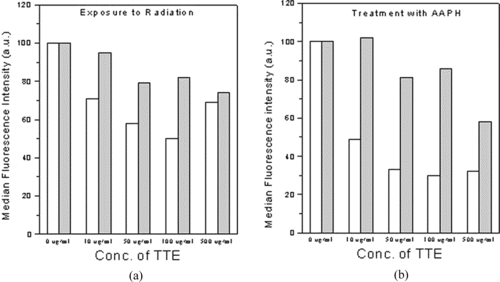
Figure 2 Presence of TTE during induction of oxidative stress was required for optimal protection against intracellular ROS. Cells treated with TTE for 1 h were subsequently exposed to (a) a dose of 2 Gy γ radiation, (b) 250 µM AAPH. All the samples were taken in triplicate, and the average median fluorescence intensity is expressed as the percent change over the control value. Open bars indicate ROS in cells exposed to 2 Gy in the presence of TTE. Closed bars indicate ROS in cells exposed to 2 Gy after removal of TTE. Data from one of the three similar experiments are shown.

Figure 3 TTE protected against radiation-induced apoptosis. Spleen cells were cultured for 24 h after irradiation and labeled with propidium iodide. Percent apoptotic cells were estimated as those with < G0/G1 DNA content. Flow cytometric profiles (a–d) and histograms (e, f) of different groups are shown: (a) control, (b) 1 Gy irradiated, (c) 1 Gy irradiated in presence of 50 µg/mL TTE, (d) 1 Gy irradiated in presence of 100 µg/mL TTE, (e) exposed to 1 Gy immediately after addition of 100 µg/mL TTE, or (f) exposed to 1 Gy 24 h after culture with 100 µg/mL TTE. All the samples were taken in triplicate, and the results are expressed as mean percent apoptotic cells ± SEM. Representative data from one of the three similar experiments are shown.
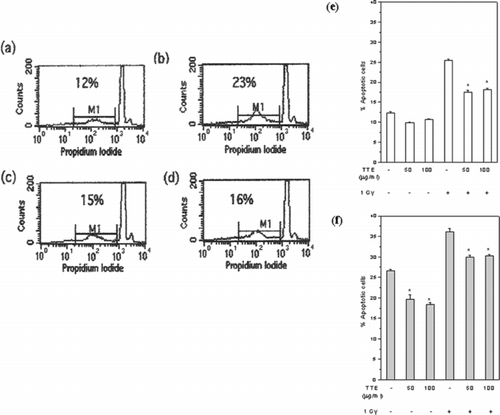
Figure 3 TTE protected against radiation-induced apoptosis. Spleen cells were cultured for 24 h after irradiation and labeled with propidium iodide. Percent apoptotic cells were estimated as those with < G0/G1 DNA content. Flow cytometric profiles (a–d) and histograms (e, f) of different groups are shown: (a) control, (b) 1 Gy irradiated, (c) 1 Gy irradiated in presence of 50 µg/mL TTE, (d) 1 Gy irradiated in presence of 100 µg/mL TTE, (e) exposed to 1 Gy immediately after addition of 100 µg/mL TTE, or (f) exposed to 1 Gy 24 h after culture with 100 µg/mL TTE. All the samples were taken in triplicate, and the results are expressed as mean percent apoptotic cells ± SEM. Representative data from one of the three similar experiments are shown.

Figure 4 TTE was mitogenic to murine spleen cells. Spleen cells were cultured with TTE, and the proliferation response was measured by [3H]-thymidine incorporation 48 and 72 h after culture. The samples were taken in six replicates, and the results are expressed as mean counts per minute ± SEM. Representative data from one of the three similar experiments are shown.

Figure 4 TTE was mitogenic to murine spleen cells. Spleen cells were cultured with TTE, and the proliferation response was measured by [3H]-thymidine incorporation 48 and 72 h after culture. The samples were taken in six replicates, and the results are expressed as mean counts per minute ± SEM. Representative data from one of the three similar experiments are shown.

Reprints and Corporate Permissions

Please note: Selecting permissions does not provide access to the full text of the article, please see our help page How do I view content?

To request a reprint or corporate permissions for this article, please click on the relevant link below:

Academic Permissions

Please note: Selecting permissions does not provide access to the full text of the article, please see our help page How do I view content?

Obtain permissions instantly via Rightslink by clicking on the button below:

If you are unable to obtain permissions via Rightslink, please complete and submit this Permissions form. For more information, please visit our Permissions help page.