347
Views
1
CrossRef citations to date
0
Altmetric
Research Article

Effect of tea catechins on erythrocyte Ca++-pump in type 2 diabetes mellitus

&
Pages 440-443 | Received 06 Jan 2008, Accepted 19 Mar 2008, Published online: 01 May 2009

Figures & data

Figure 1. Structure of catechins.

Figure 1.  Structure of catechins.

Figure 2. Concentration-dependent effect of tea catechins on erythrocyte membrane Ca++-ATPase activity. (A) Normal human: EGCG, EGC show significant (p <0.01) activation of Ca2+ ATPase at 10−5 M concentration. ECG and EC show significant activation only at 10−3 and 10−4 M. (B) Type 2 diabetic patients: EGCG, EGC, ECG, EC show significant activation of Ca2+ ATPase at 10−3 – 10−5 M concentration. *Ca++ ATPase activity is expressed as μmol of Pi released /h/mg membrane protein at 37°C. Values are mean ± SD.
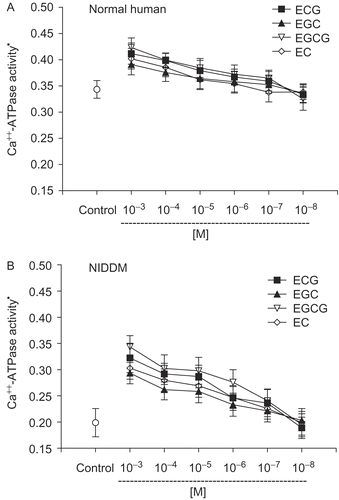
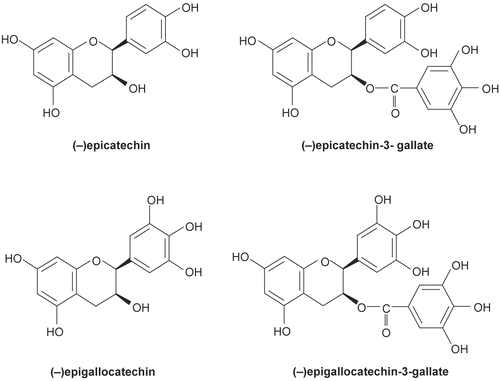
Figure 2.  Concentration-dependent effect of tea catechins on erythrocyte membrane Ca++-ATPase activity. (A) Normal human: EGCG, EGC show significant (p <0.01) activation of Ca2+ ATPase at 10−5 M concentration. ECG and EC show significant activation only at 10−3 and 10−4 M. (B) Type 2 diabetic patients: EGCG, EGC, ECG, EC show significant activation of Ca2+ ATPase at 10−3 – 10−5 M concentration. *Ca++ ATPase activity is expressed as μmol of Pi released /h/mg membrane protein at 37°C. Values are mean ± SD.

Reprints and Corporate Permissions

Please note: Selecting permissions does not provide access to the full text of the article, please see our help page How do I view content?

To request a reprint or corporate permissions for this article, please click on the relevant link below:

Academic Permissions

Please note: Selecting permissions does not provide access to the full text of the article, please see our help page How do I view content?

Obtain permissions instantly via Rightslink by clicking on the button below:

If you are unable to obtain permissions via Rightslink, please complete and submit this Permissions form. For more information, please visit our Permissions help page.