538
Views
2
CrossRef citations to date
0
Altmetric
Research Article

Antinociceptive, anti-inflammatory, and antioxidant properties of Phoradendron piperoides leaves

, , , , , , , & show all
Pages 645-652 | Received 13 Feb 2008, Accepted 03 Jun 2008, Published online: 22 Jun 2009

Figures & data

Table 1. Phytochemical screening of P. piperoides ME.

Figure 1. Influence of P. piperoides methanol extract (ME) in nociceptive behavior of mice evaluated in acetic acid-induced abdominal writhing model. Nociception was registered by the number of writhes that the animal presented 20 min following i.p. acetic acid injection. Groups of animals were pre-treated with vehicle (C, control group, open column, n = 9), indomethacin (Indo, 10 mg/kg, cross-hatched column, n = 9), or ME (50– 400 mg/kg, right-hatched columns, n = 9/dose), p.o., 60 min before irritant agent. Each column represents the mean ± SEM. Asterisks denote statistical significance, *p < 0.01 and **p < 0.001, in relation to control group. ANOVA followed by Tukey’s test.
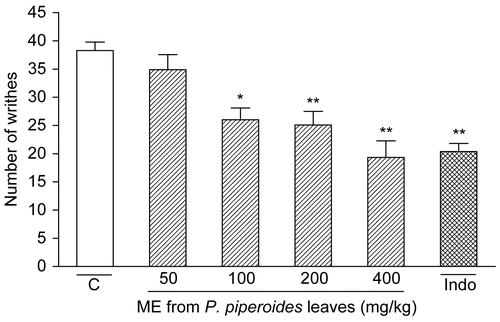
Figure 1.  Influence of P. piperoides methanol extract (ME) in nociceptive behavior of mice evaluated in acetic acid-induced abdominal writhing model. Nociception was registered by the number of writhes that the animal presented 20 min following i.p. acetic acid injection. Groups of animals were pre-treated with vehicle (C, control group, open column, n = 9), indomethacin (Indo, 10 mg/kg, cross-hatched column, n = 9), or ME (50– 400 mg/kg, right-hatched columns, n = 9/dose), p.o., 60 min before irritant agent. Each column represents the mean ± SEM. Asterisks denote statistical significance, *p < 0.01 and **p < 0.001, in relation to control group. ANOVA followed by Tukey’s test.

Figure 2. Influence of P. piperoides ME on nociceptive behavior of mice in the hot-plate test. Nociception was evaluated as the latency (reaction time, in s) for animals to elevate paws from the plate warmed to 55 ± 0.5°C. Groups of mice were pre-treated with vehicle (C, control group, 10 mL/kg, p.o., 60 min beforehand, n = 9), morphine (Morph, 10 mg/kg, i.p., 30 min beforehand, n = 9), or P. piperoides ME (100– 400 mg/kg, p.o., 60 min beforehand, n = 9/dose) and measurements were performed at times 0 (right-hatched columns), 15 (cross-hatched columns), 30 (striped columns), and 60 min (squared columns) after the first thermal stimulus. Each column represents the mean ± SEM. Asterisks denote statistical significance, *p < 0.001 in relation to control group. ANOVA followed by Tukey’s test.
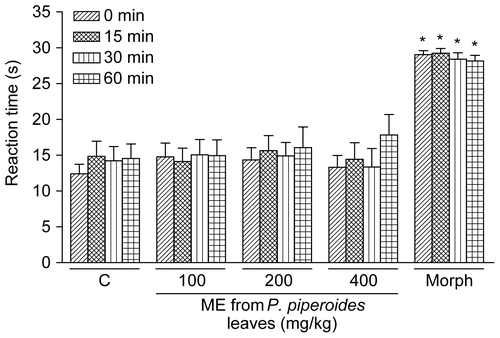
Figure 2.  Influence of P. piperoides ME on nociceptive behavior of mice in the hot-plate test. Nociception was evaluated as the latency (reaction time, in s) for animals to elevate paws from the plate warmed to 55 ± 0.5°C. Groups of mice were pre-treated with vehicle (C, control group, 10 mL/kg, p.o., 60 min beforehand, n = 9), morphine (Morph, 10 mg/kg, i.p., 30 min beforehand, n = 9), or P. piperoides ME (100– 400 mg/kg, p.o., 60 min beforehand, n = 9/dose) and measurements were performed at times 0 (right-hatched columns), 15 (cross-hatched columns), 30 (striped columns), and 60 min (squared columns) after the first thermal stimulus. Each column represents the mean ± SEM. Asterisks denote statistical significance, *p < 0.001 in relation to control group. ANOVA followed by Tukey’s test.

Figure 3. Effect of P. piperoides ME in nociceptive behavior of mice evaluated in formalin-induced nociception model. Groups of mice were pre-treated with vehicle (columns C, control groups, 10 mL/kg, p.o., 60 min beforehand, n = 9), indomethacin (Indo, 10 mg/kg, p.o., 60 min beforehand, n = 9), morphine (Morph, 10 mg/kg, i.p., 30 min beforehand, n = 9), or P. piperoides ME (100– 400 mg/kg, p.o., 60 min beforehand, n = 9/dose) against the early phase (0–5 min, right-hatched columns) or late phase (20–25 min, cross-hatched columns) of formalin-induced nociception in mice. Each column represents the mean ± SEM. Asterisks denote statistical significance, *p < 0.05 and **p < 0.001 in relation to control group. ANOVA followed by Tukey’s test.
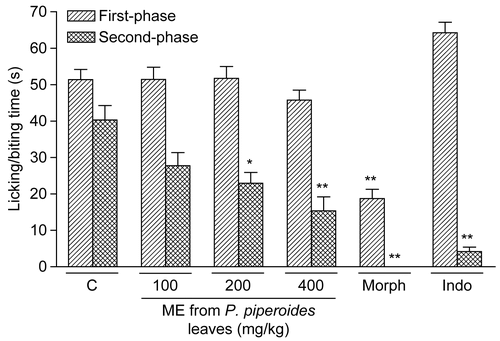
Figure 3.  Effect of P. piperoides ME in nociceptive behavior of mice evaluated in formalin-induced nociception model. Groups of mice were pre-treated with vehicle (columns C, control groups, 10 mL/kg, p.o., 60 min beforehand, n = 9), indomethacin (Indo, 10 mg/kg, p.o., 60 min beforehand, n = 9), morphine (Morph, 10 mg/kg, i.p., 30 min beforehand, n = 9), or P. piperoides ME (100– 400 mg/kg, p.o., 60 min beforehand, n = 9/dose) against the early phase (0–5 min, right-hatched columns) or late phase (20–25 min, cross-hatched columns) of formalin-induced nociception in mice. Each column represents the mean ± SEM. Asterisks denote statistical significance, *p < 0.05 and **p < 0.001 in relation to control group. ANOVA followed by Tukey’s test.
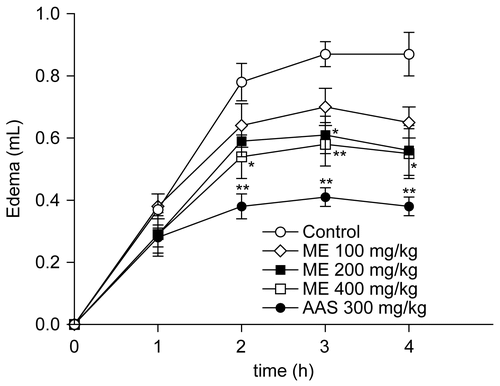
Figure 4. Effect of P. piperoides ME on rat paw edema induced by carrageenan. Groups of rats were pre-treated with vehicle (control group, 10 mL/kg, p.o., n = 6), aspirin (AAS, 300 mg/kg, p.o., n = 6), or P. piperoides ME in concentrations of 100, 200, and 400 mg/kg (p.o., n = 6/dose) 60 min before carrageenan-induced paw edema. Measurements were performed at times 0, 1, 2, 3, and 4 h after the subplantar injection of carrageenan (1%, 100 μL). Each value represents the mean ± SEM. Asterisks denote statistical significance, *p < 0.05 and **p < 0.001 in relation to control group. ANOVA followed by Tukey’s test.

Figure 4.  Effect of P. piperoides ME on rat paw edema induced by carrageenan. Groups of rats were pre-treated with vehicle (control group, 10 mL/kg, p.o., n = 6), aspirin (AAS, 300 mg/kg, p.o., n = 6), or P. piperoides ME in concentrations of 100, 200, and 400 mg/kg (p.o., n = 6/dose) 60 min before carrageenan-induced paw edema. Measurements were performed at times 0, 1, 2, 3, and 4 h after the subplantar injection of carrageenan (1%, 100 μL). Each value represents the mean ± SEM. Asterisks denote statistical significance, *p < 0.05 and **p < 0.001 in relation to control group. ANOVA followed by Tukey’s test.

Table 2. Radical scavenging activities of P. piperoides extract and partitions determined by the reduction of DPPH free radical.
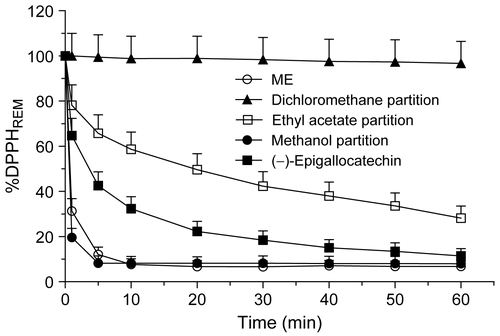
Figure 5. Kinetic behavior acquired spectrophotometrically at 515 nm, by reacting extract and partitions of P. piperoides leaves (67 μg/mL) with methanol solution of DPPH. Evaluated samples: ME, dichloromethane, ethyl acetate, and methanol partitions, and (–)-epigallocatechin.

Figure 5.  Kinetic behavior acquired spectrophotometrically at 515 nm, by reacting extract and partitions of P. piperoides leaves (67 μg/mL) with methanol solution of DPPH. Evaluated samples: ME, dichloromethane, ethyl acetate, and methanol partitions, and (–)-epigallocatechin.

Reprints and Corporate Permissions

Please note: Selecting permissions does not provide access to the full text of the article, please see our help page How do I view content?

To request a reprint or corporate permissions for this article, please click on the relevant link below:

Academic Permissions

Please note: Selecting permissions does not provide access to the full text of the article, please see our help page How do I view content?

Obtain permissions instantly via Rightslink by clicking on the button below:

If you are unable to obtain permissions via Rightslink, please complete and submit this Permissions form. For more information, please visit our Permissions help page.