Figures & data
Figure 1. UPLC–Q–TOF/MS total ion current chromatograms of EFE in negative mode.
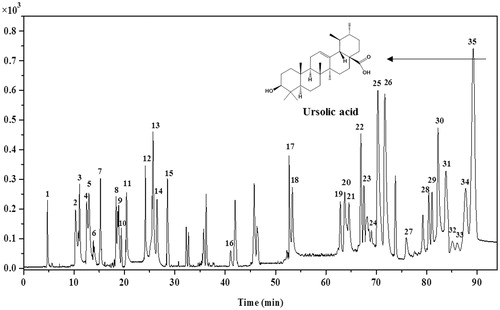
Table 1. Compounds identified by UPLC–Q–TOF/MS in EFE and their relative content.
Figure 2. Influences of control (1) positive isoprenaline 0.01 μg/mL (2), the petroleum ether, ethyl acetate, n-butanol, and residuary water fraction of FE [200 mg (crude material mass)/mL] (3, 4, 5, 6, respectively) on the resting tension in guinea pig tracheal strips. Symbols and vertical bars represent means and SEM ANOVA followed by Dunnett’s multiple comparison test. Compared with control *p < 0.05, **p < 0.01 (n = 6).
![Figure 2. Influences of control (1) positive isoprenaline 0.01 μg/mL (2), the petroleum ether, ethyl acetate, n-butanol, and residuary water fraction of FE [200 mg (crude material mass)/mL] (3, 4, 5, 6, respectively) on the resting tension in guinea pig tracheal strips. Symbols and vertical bars represent means and SEM ANOVA followed by Dunnett’s multiple comparison test. Compared with control *p < 0.05, **p < 0.01 (n = 6).](/cms/asset/c8e4b578-a87d-4932-be7c-cde9bf675634/iphb_a_1183134_f0002_b.jpg)
Figure 3. Influences of control (a) positive isoprenaline 0.01 μg/mL (b) the ethyl acetate fraction at 0.075, 0.15 and 0.3 mg/mL (3, 4 and 5, respectively) on the non-precontracted (a) and pre-contracted strip by Ach and His (b). Influences of EFE (0.3 mg/mL) on cumulative Ach (c, 0.02–20 μM) or His (d, 0.02–20 μM)-induced contraction in guinea pig tracheal strips. Representative tracings of the contraction of trachea treated with Ach in response to (e) control and (f) EFE 0.3 mg/mL. Symbols and vertical bars represent means and SEM. ANOVA followed by Dunnett’s Multiple Comparison Test. *p < 0.05, **p < 0.01 (n = 6).
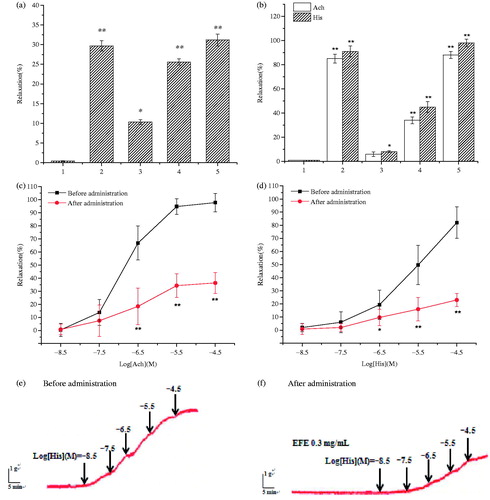
Figure 4. Effects of different inhibitors on EFE-induced bronchodilator in guinea pig tracheal strips. (a) Effect of propranolol 1 μM on EFE-induced relaxation. (b) Effect of theophylline 0.1 mM on EFE-induced relaxation. (e) Effect of l-NAME 0.1 mM on EFE-induced relaxation. (f) Effect of INDO 0.01 mM on EFE-induced relaxation. (g) Effect of ODQ 1 μM on EFE-induced relaxation. Representative force traces which show relaxation induced by EFE in tracheal strips pre-incubated with the (c) propranolol and (d) theophylline. Symbols and vertical bars represent means and SEM. ANOVA followed by Dunnett’s multiple comparison test. Compared with control *p < 0.05, **p < 0.01 (n = 6).
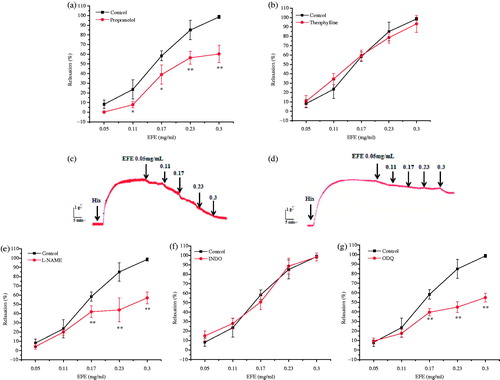
Figure 5. (a) Dose-effect curves of CaCl2 on guinea pig tracheal strips in the absence and in the presence of EFE. (b) Bronchodilator effects of EFE on His pre-contracted tracheal strips in Ca2+-free solution. Symbols and vertical bars represent means and SEM. ANOVA followed by Dunnett’s multiple comparison test. Compared with control *p < 0.05, **p < 0.01 (n = 6).
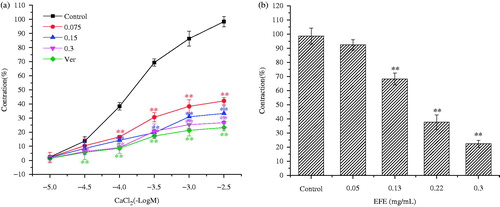
Figure 6. Effects of the pretreatment with different K+ channels blockers on the EFE-induced relaxation in guinea pig tracheal strips. (a) Effect of TEA 1 mM on the EFE-induced relaxation. (b) Effect of 4-AP 0.1 mM on the EFE-induced relaxation. (c) Effect of Gli 0.01 mM on the EFE-induced relaxation. Symbols and vertical bars represent means and SEM. ANOVA followed by Dunnett’s multiple comparison test. Compared with control *p < 0.05, **p < 0.01 (n = 6).
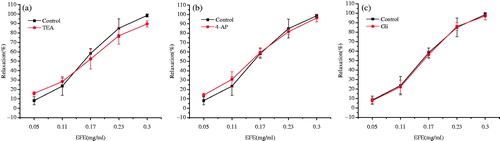
Figure 7. (a) Influences of UA from 5 to 30 μg/mL (equal to EFE from 0.05 to 0.3 mg/mL) and EFE from 0.05 to 0.3 mg/mL on the pre-contracted strip by His (2 μM). (b) Effect of l-NAME 0.1 mM on UA-induced relaxation. (c) Effect of ODQ 1 μM on UA-induced relaxation. Symbols and vertical bars represent means and SEM. ANOVA followed by Dunnett’s multiple comparison test. Compared with control *p < 0.05, **p < 0.01 (n = 6).
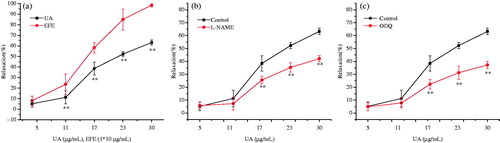
Figure 8. Influences of control (1), positive isoprenaline 0.05 mg/kg (2), the EFE at 50, 125 and 200 (crude material mass) mg/mL (3, 4 and 5, respectively) on Ach and His-induced bronchospasm in guinea pigs. Symbols and vertical bars represent means and SEM. ANOVA followed by Dunnett’s multiple comparison test. Compared with control *p < 0.05, **p < 0.01 (n = 10).
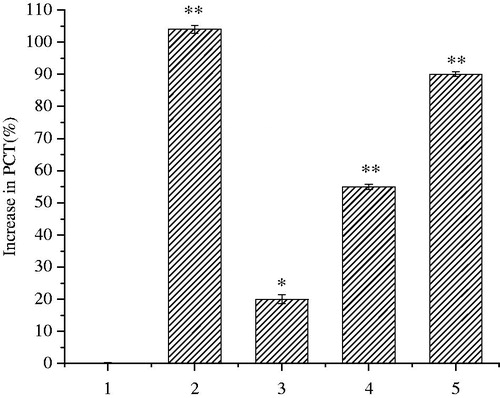
Table 2. Effects of different fractions of FE on Ach- and His-induced bronchospasm in guinea pigs.
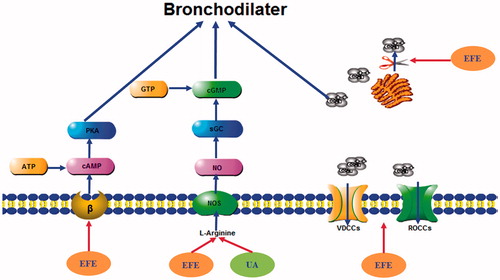
Figure 9. Schematic mechanisms of the bronchodilator effect of EFE and UA on isolated tracheal strips. cAMP: cyclic adenosine monophosphate; ATP: adenosine triphosphate; PKA, protein kinase A; sGC: soluble guanylyl cyclase; cGMP: cyclic guanosine monophosphate; GTP: guanosine triphosphate; VDCCs: voltage-dependent Ca2+ channels; ROCCs: receptor-operated Ca2+ channels.