Figures & data
Figure 1. A and B: H&E staining of liver tissues isolated from CCl4-exposed rats demonstrates focal hepatocyte necrosis, as well as, increased infiltration of the inflammatory cells into the portal tract in the APAP-induced hepatotoxic mice; Fatty degeneration and central vein dilation were obvious (magnification ×400). C and D: No hepatocellular necrosis and APAP-induced damage was observed in metformin (200 mg/kg)- and NAC (100 mg/kg)-treated mice (magnification ×200).
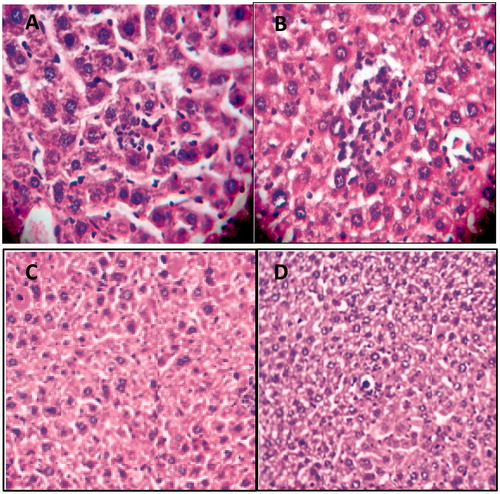
Table 1. Histopathological evaluation of liver tissue obtained from control, APAP-induced hepatotoxic treated with either normal saline or metformin 200 mg/kg.
Figure 2. The liver tissue levels of injury biomarkers (ALT, AST and ALP) in the control and subacute APAP-treated BALB/c mice receiving normal saline,metformin (50, 100 and 200 mg/kg) and NAC (100 mg/kg). The values are expressed as mean ± SD and analyzed using one-way ANOVA method followed by Tukey's post test. *p < 0.05, **p < 0.01, ***p < 0.001 compared to APAP/normal saline group; +++p < 0.001 compared to APAP/metformin 100 mg/kg group. ns: non-significant.
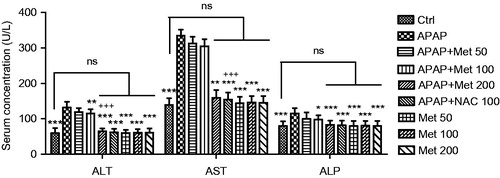
Figure 3. The liver tissue levels of MDA and antioxidants SOD and GSH activity levels in the control and subacute APAP-treated BALB/c mice receiving normal saline, metformin (50, 100 and 200 mg/kg) and NAC (100 mg/kg). The values are expressed as mean ± SD and analyzed using one-way ANOVA method followed by Tukey's post test. ***p < 0.001 compared to APAP/normal saline group; +++p < 0.05 compared to APAP/metformin 100 mg/kg group. ns: non-significant.
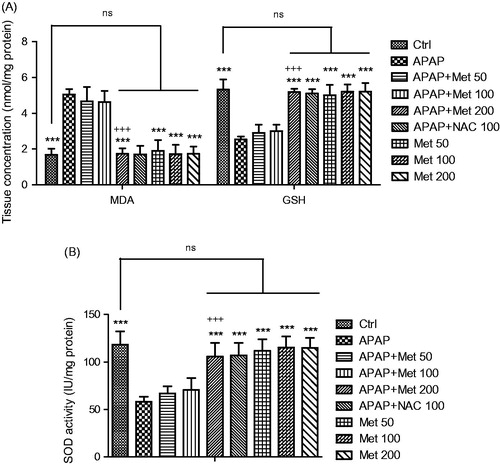
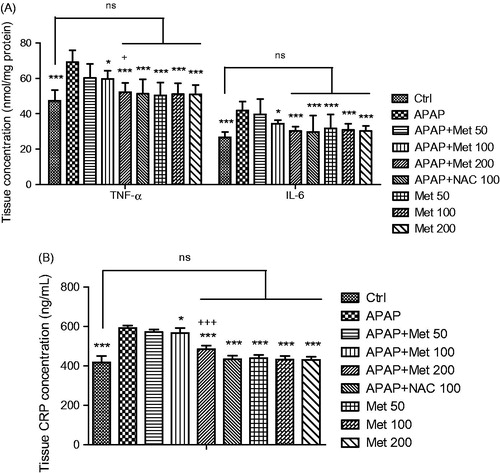
Figure 4. The serum levels of pro-inflammatory factors (IL-6, TNF-α and CRP) in the control and subacute APAP-treated BALB/c mice receiving normal saline, metformin (50, 100 and 200 mg/kg) and NAC (100 mg/kg). The values are expressed as mean ± SD and analyzed using one-way ANOVA method followed by Tukey's post test. *p < 0.05, ***p < 0.001 compared to APAP/normal saline group; +p < 0.05 compared to APAP/metformin 100 mg/kg group; +++p < 0.001. ns: non-significant.