
Figures & data
Figure 1. Treatment protocol.
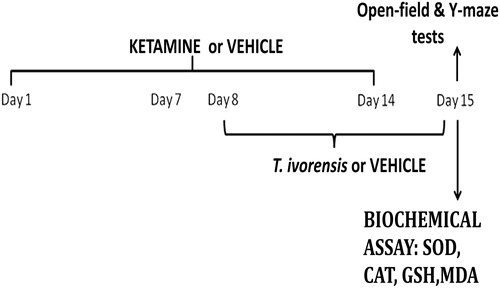
Table 1. Effect of EETI on reversal treatment of ketamine-induced hyperlocomotion.
Figure 2. Effect of EETI on reversal treatment of ketamine-induced cognitive dysfunction. Value represents the mean ± S.E.M of five animals/group. One way ANOVA revealed that there is significant [F (5, 24) = 13.55, p < 0.0001] difference between various treatment groups. **Denotes p < 0.05 as compared to vehicle group. *Denotes p < 0.05 as compared with ketamine group. KET: Ketamine; RIS: Risperidone; EETI: Ethanol extract of T. ivorensis stem bark.
![Figure 2. Effect of EETI on reversal treatment of ketamine-induced cognitive dysfunction. Value represents the mean ± S.E.M of five animals/group. One way ANOVA revealed that there is significant [F (5, 24) = 13.55, p < 0.0001] difference between various treatment groups. **Denotes p < 0.05 as compared to vehicle group. *Denotes p < 0.05 as compared with ketamine group. KET: Ketamine; RIS: Risperidone; EETI: Ethanol extract of T. ivorensis stem bark.](/cms/asset/abed225f-8ef6-4266-a0c8-70ebb18d85fa/iphb_a_1190382_f0002.jpg)
Figure 3. Effect of EETI on superoxide dismutase (SOD) activity in mouse brain. Value represents the mean ± S.E.M of five animals/group. One way ANOVA revealed that there is significant [F (5, 24) = 62.51, p < 0.0001] difference between various treatment groups. **Denotes p < 0.05 as compared to vehicle group. *Denotes p < 0.05 as compared with ketamine group. KET: Ketamine; RIS: Risperidone; EETI: Ethanol extract of T. ivorensis stem bark.
![Figure 3. Effect of EETI on superoxide dismutase (SOD) activity in mouse brain. Value represents the mean ± S.E.M of five animals/group. One way ANOVA revealed that there is significant [F (5, 24) = 62.51, p < 0.0001] difference between various treatment groups. **Denotes p < 0.05 as compared to vehicle group. *Denotes p < 0.05 as compared with ketamine group. KET: Ketamine; RIS: Risperidone; EETI: Ethanol extract of T. ivorensis stem bark.](/cms/asset/afad75db-ad7c-45d5-944e-9840ebd52328/iphb_a_1190382_f0003.jpg)
Figure 4. Effect of EETI on catalase (CAT) activity in mouse brain. Value represents the mean ± S.E.M of five animals/group. One way ANOVA revealed that there is significant [F (5, 24) = 33.24, p < 0.0001] difference between various treatment groups. **Denotes p < 0.05 as compared to vehicle group. *Denotes p < 0.05 as compared with ketamine group. KET: Ketamine; RIS: Risperidone; EETI: Ethanol extract of T. ivorensis stem bark.
![Figure 4. Effect of EETI on catalase (CAT) activity in mouse brain. Value represents the mean ± S.E.M of five animals/group. One way ANOVA revealed that there is significant [F (5, 24) = 33.24, p < 0.0001] difference between various treatment groups. **Denotes p < 0.05 as compared to vehicle group. *Denotes p < 0.05 as compared with ketamine group. KET: Ketamine; RIS: Risperidone; EETI: Ethanol extract of T. ivorensis stem bark.](/cms/asset/4c7266d0-bb05-40b4-8f25-e7e23899d7cd/iphb_a_1190382_f0004.jpg)
Figure 5. Effect of EETI on glutathione (GSH) activity in mouse brain. Value represents the mean ± S.E.M of five animals/group. One way ANOVA revealed that there is significant [F (5, 24) = 26.77, p < 0.0001] difference between various treatment groups. **Denotes p < 0.05 as compared to vehicle group. *Denotes p < 0.05 as compared with ketamine group. KET: Ketamine; RIS: Risperidone; EETI: Ethanol extract of T. ivorensis stem bark.
![Figure 5. Effect of EETI on glutathione (GSH) activity in mouse brain. Value represents the mean ± S.E.M of five animals/group. One way ANOVA revealed that there is significant [F (5, 24) = 26.77, p < 0.0001] difference between various treatment groups. **Denotes p < 0.05 as compared to vehicle group. *Denotes p < 0.05 as compared with ketamine group. KET: Ketamine; RIS: Risperidone; EETI: Ethanol extract of T. ivorensis stem bark.](/cms/asset/30137fb9-7c99-409f-80be-2e4f9a5c0764/iphb_a_1190382_f0005.jpg)
Figure 6. Effect of EETI on MDA content in mouse brain. Value represents the mean ± S.E.M of five animals/group. One way ANOVA revealed that there is significant [F (5, 24) = 24.50, p < 0.0001] difference between various treatment groups. **Denotes p < 0.05 as compared to vehicle group. *Denotes p < 0.05 as compared with ketamine group. KET: Ketamine; RIS: Risperidone; EETI: Ethanol extract of T. ivorensis stem bark.
![Figure 6. Effect of EETI on MDA content in mouse brain. Value represents the mean ± S.E.M of five animals/group. One way ANOVA revealed that there is significant [F (5, 24) = 24.50, p < 0.0001] difference between various treatment groups. **Denotes p < 0.05 as compared to vehicle group. *Denotes p < 0.05 as compared with ketamine group. KET: Ketamine; RIS: Risperidone; EETI: Ethanol extract of T. ivorensis stem bark.](/cms/asset/27b15ac1-c2ac-4540-8630-599cbc886cfa/iphb_a_1190382_f0006.jpg)