Figures & data
Table 1. Chemical composition of EOX.
Figure 1. Percentage of haemolysis in red blood cells of Swiss mice after treatment with EOX (μg/ml). Each dot represents the average ± SEM of three experiments with three replicates, with 95% CI.
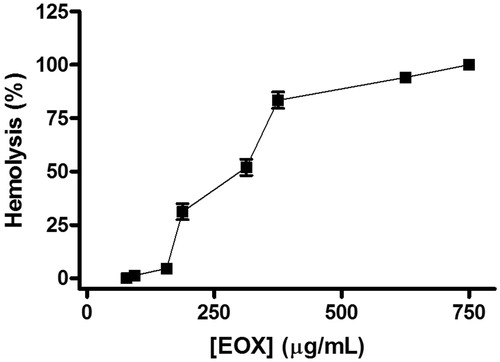
Table 2. Antiproliferative activity of EOX and doxorubicin against human cancer cell linesTable Footnotea.
Table 3. Behavioural effects of acute intraperitoneal treatment of EOX in mice.
Table 4. Effect of intraperitoneal administration of EOX (250, 375 e 500 mg/kg) on feed and water consumption and body weight gain in mice (14 d).
Table 5. Number of micronucleated erythrocytes in peripheral blood of mice treated with single doses of EOX and cyclophosphamide (n = 6).
Table 6. Feed and water consumption and body weight gain of animals (n = 6) subjected to different treatments (7 d).
Table 7. Effects of 5-FU and EOX on the mice organ indices (n = 6) subjected to different treatments (7 d).
Figure 2. Effect of EOX and 5-FU on tumour weight and inhibition of tumour growth in mice transplanted with sarcoma 180. Data are expressed as mean ± SEM of six animals and were analyzed by ANOVA followed by Tukey’s test. ap < .05 compared to tumour control. bp < .05 compared to EOX (50 mg/kg). cp < .05 compared to EOX (100 mg/kg).
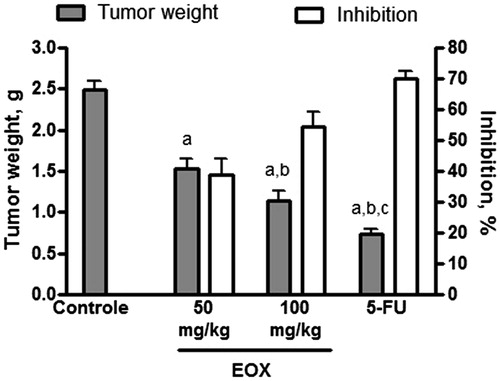
Figure 3. Histopathology of tumours of different experimental groups. (A) Tumour control: asymmetric mitoses. (B) 5-FU (25 mg/kg): coagulative necrosis areas. (C) EOX (50 mg/kg): invasion of adipose tissue (arrows). (D) EOX (50 mg/kg): invasion of skeletal muscle (arrows). (E) EOX (100 mg/kg): tumour growth advancing neural filament, without nerve infiltration (arrows). (F) EOX (100 mg/kg): coagulative necrosis areas (arrows). Haematoxylin-eosin (A, C, D, F) and Masson’s trichrome (B, E).
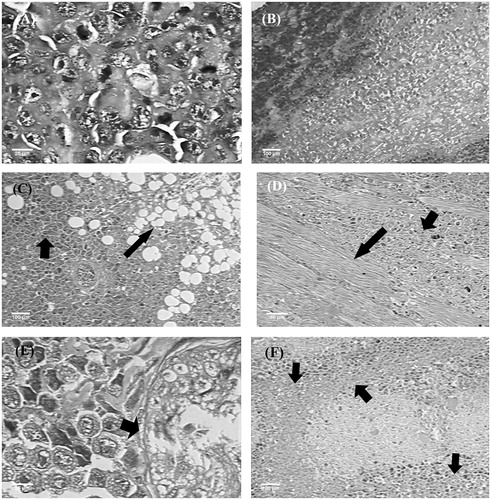
Table 8. Effects of 5-FU and EOX on biochemical and haematological parameters of peripheral blood of mice (n = 6) subjected to different treatments (7 d).
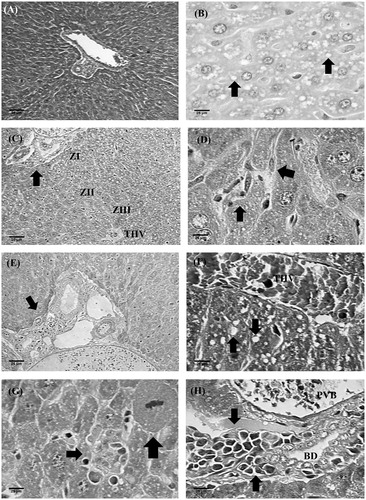
Figure 4. Histopathology of livers of different experimental groups. (A) Tumour control: normal portal triad, liver beams radially distributed from vein centre lobular, and presence of hepatic sinusoids. (B) 5-FU (25 mg/kg): microvesicular steatosis (arrows). (C) EOX (50 mg/kg): lobular architecture preserved, especially the zonal distribution of hepatocytes (zones I, II and III). Presence of mild steatosis. (D) EOX (50 mg/kg): Kupffer cell intrasinusoidal hypertrophy. (E) EOX (50 mg/kg): discreet inflammatory infiltrate on space port. (F) EOX (100 mg/kg): macrovesicular steatosis (arrow), the presence of THV-terminal hepatic vein. (G) EOX (100 mg/kg): necroinflammatory focus (short arrow) bordering dividing hepatocyte (thick arrow). (H) EOX (100 mg/kg): portal inflammatory infiltrate. PVB, portal vein branch; THV, terminal hepatic vein; BD, bile duct. Haematoxylin-eosin (A, B, C, E, F) and Masson’s trichrome (D, G, H).