Figures & data
Figure 1. GC-MS chromatogram of n-hexane extract of A. fraxinifolius leaves.
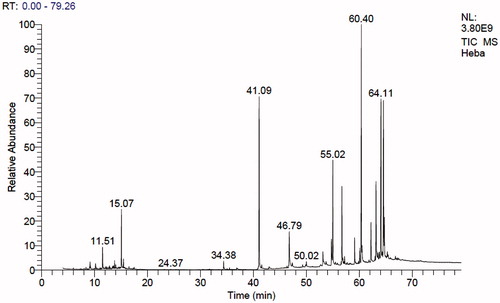
Table 1. Identification of the components of n-hexane extract of A. fraxinifolius leaves.
Figure 2. Body weight gain (A) and liver relative weight (B) of control and intoxicated rats. Values are means, with their standard errors represented by vertical bars. A. fraxinifolius: Acrocarpus fraxinifolius; APAP: N-acetyl-p-aminophenol **p < 0.01, ***p < 0.001: compared with the healthy control group; †††p < 0.001: compared with the APAP-intoxicated group that received vehicle; (one-way ANOVA with Tukey’s multiple comparison test).
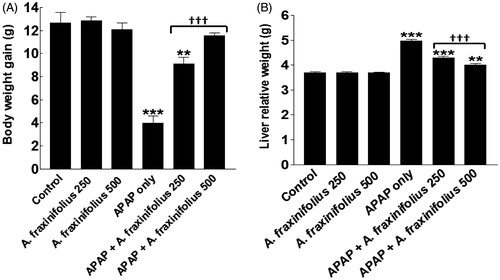
Figure 3. Serum liver enzymes markers of control and intoxicated rats. Values are means, with their standard errors represented by vertical bars. A. fraxinifolius: Acrocarpus fraxinifolius; ALAT: alanine aminotransferase; ALP: alkaline phosphatase; APAP: N-acetyl-p-aminophenol; ASAT: aspartate aminotransferase *p < 0.05, **p < 0.01,***p < 0.001: compared with the healthy control group; †††p < 0.001: compared with the APAP-intoxicated group that received vehicle; (one-way ANOVA with Tukey’s multiple comparison test).
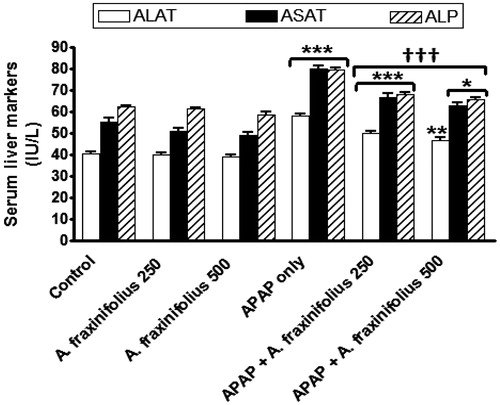
Figure 4. Serum lipid profiles (A: total cholesterol and triglycerides, B: HDL-cholesterol and LDL-cholesterol, C: atherogenic index 1 and 2) of control and intoxicated rats. Values are means, with their standard errors represented by vertical bars. A. fraxinifolius: Acrocarpus fraxinifolius; APAP: N-acetyl-p-aminophenol Atherogenic index (1), total cholesterol: HDL-cholesterol ratio; atherogenic index (2), LDL-cholesterol: HDL-cholesterol ratio *p < 0.05, **p < 0.01, ***p < 0.001: compared with the healthy control group; †††p < 0.001: compared with the APAP-intoxicated group that received vehicle; (one-way ANOVA with Tukey’s multiple comparison test).
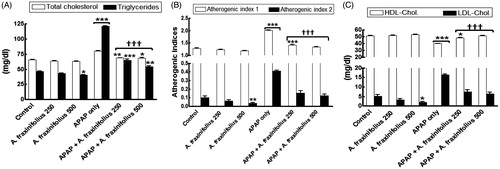
Figure 5. Serum total protein, albumin and globulin levels (A) and A/G ratio (B) of control and intoxicated rats. Values are means, with their standard errors represented by vertical bars. A. fraxinifolius: Acrocarpus fraxinifolius; APAP: N-acetyl-p-aminophenol *p < 0.05, **p < 0.01, ***p < 0.001: compared with the healthy control group; †p < 0.05: compared with the APAP-intoxicated group that received vehicle; (one-way ANOVA with Tukey’s multiple comparison test).
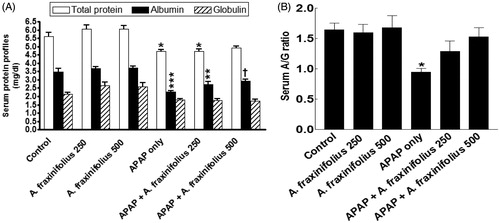
Figure 6. Serum total, direct and indirect bilirubin levels of control and intoxicated rats. Values are means, with their standard errors represented by vertical bars. A. fraxinifolius: Acrocarpus fraxinifolius; APAP: N-acetyl-p-aminophenol **p < 0.01, ***p < 0.001: compared with the healthy control group; †p < 0.05, †††p < 0.001: compared with the APAP-intoxicated group that received vehicle; (one-way ANOVA with Tukey’s multiple comparison test).
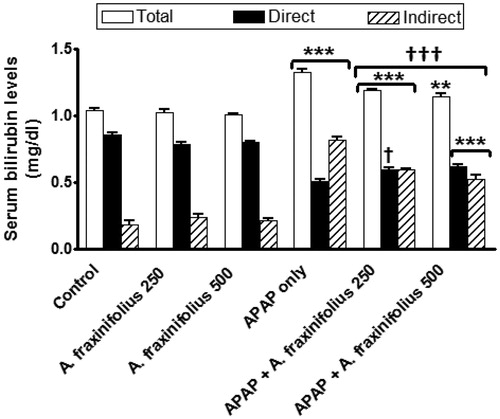
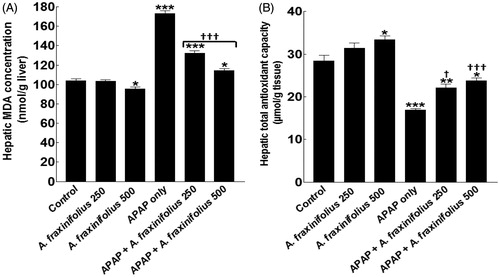
Figure 7. Hepatic MDA concentration (A) and total antioxidant capacity (B) of control and intoxicated rats. Values are means, with their standard errors represented by vertical bars. A. fraxinifolius: Acrocarpus fraxinifolius; APAP: N-acetyl-p-aminophenol; MDA: malondialdehyde *p < 0.05, **p < 0.01, ***p < 0.001: compared with the healthy control group; †p < 0.05, †††p < 0.001: compared with the APAP-intoxicated group that received vehicle; (one-way ANOVA with Tukey’s multiple comparison test).