Figures & data
Figure 1. Flow chart or schematic representation of the current study.
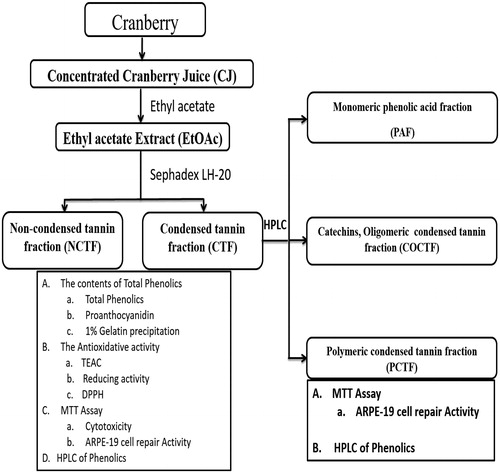
Table 1. The contents of total phenolics in cranberry juice.
Table 2. The contents of total phenolics in EtOAc extract of CJ and its separated fractions.
Figure 2. High performance of liquid chromatogram (HPLC) of EtAOc extract (A), NCTF (B) and CTF (C). 1 = gallic acid, 2 = catechin, 3 = epicatechin, 4 = caffeic acid, 5 = coumuric acid, 6 = myricetin, 7 = quercetin, and 8 = cinnamic acid. HPLC Running Condition: Mobile phase- 2.5% (v/v) acetic acid water solution (solvent A) and acetonitrile (solvent B). The gradient program consisted of 3% B, initially, changing to 21% B after 4 min, was maintained at 21% B until 10 min and raised to 22% B after 11 min, was maintained at 22% B until 15 min and raised to 30% B after 16 min, was increased to 50% B after 15 min and raised to 80% B after 15 min, and was maintained at 100% B until 40 min and then reduced to 3% B after 45 min. The injection volume of all the samples was 20 μL. Simultaneous monitoring was performed at 280 nm, and the flow rate was 0.8 mL/min.
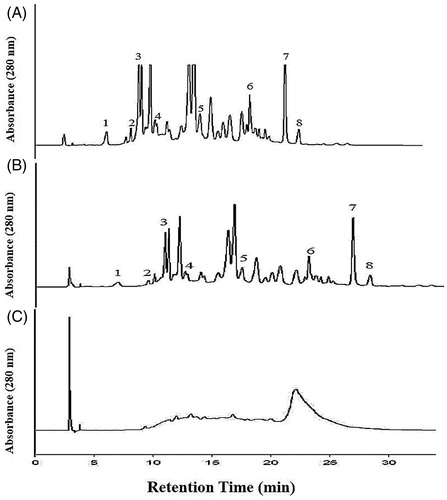
Figure 3. The high performance of liquid chromatograms (HPLC) of condensed tannin containing fraction’s separated fractions. (A) Phenolic acids containing monomeric fraction. (B) Catechin, oligomeric condensed tannin containing fraction. (C) Polymeric condensed tannin containing fraction. The mobile phase consisted of 2.5% (v/v) aqueous acetic acid solution (solvent A) and acetonitrile (solvent B). The gradient program consisted of 3% B, initially, changing to 21% B after 4 min, was maintained at 21% B until 10 min and raised to 22% B after 11 min, was maintained at 22% B until 15 min and raised to 35% B after 16 min, was maintained at 35% B until 35 min and raised to 100% B after 36 min, and was maintained at 100% B until 40 min and then reduced to 3% B after 45 min. The injection volume of all the samples was 20 μL. Simultaneous monitoring was performed at 280 nm, and the flow rate was 0.8 mL/min.
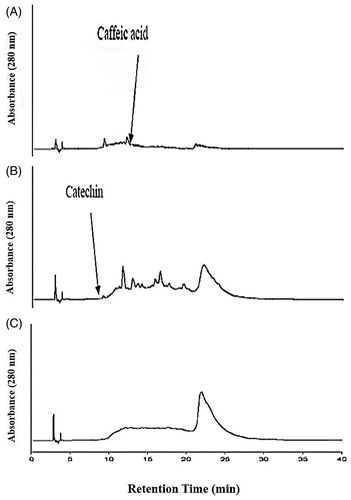
Figure 4. The reducing activity (A) and DPPH (B) scavenging ability of EtOAc extract and its various fractions of CJ. Values were expressed as means ± SD. Data bearing different letters were significantly different (p < 0.05). Vit C (ascorbic acid) used as a standard.
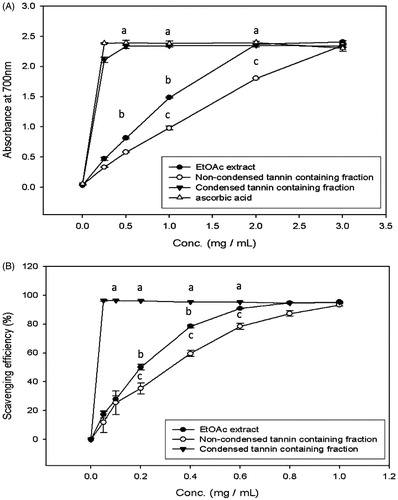
Table 3. The total antioxidant capacity of EtOAc extract of CJ and its separated fractions.
Figure 5. Effect of EtOAc extract of CJ on cell viability of ARPE-19 cells. Values were expressed as means ± SD. Data bearing different letters were significantly different (p < 0.05).
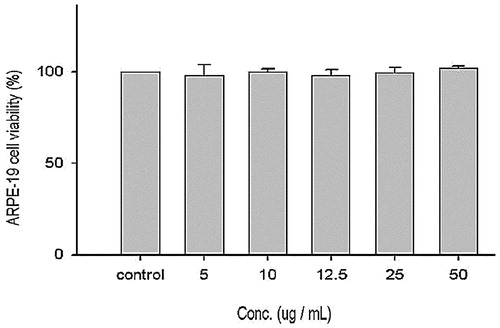
Figure 6. Effect of EtOAc extract of CJ on the proliferation of ARPE-19 cells. Values were expressed as means ± SD. *Significantly different as compared with control for EtOAc extract (p < 0.05). #Significantly different as compared with control for β-carotene (p < 0.05). *Significant difference between two fractions (p < 0.05).
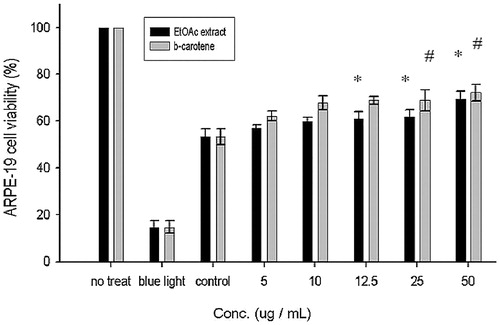
Figure 7. Effect of NCTF and CTF of CJ on the proliferation of ARPE-19 cells. Values were expressed as means ± SD. *Significant different as compared with control for non-condensed tannin containing fraction (p < 0.05). #Significant different as compared with control for condensed tannin containing fraction (p < 0.05). @Significant difference between two fractions (p < 0.05).
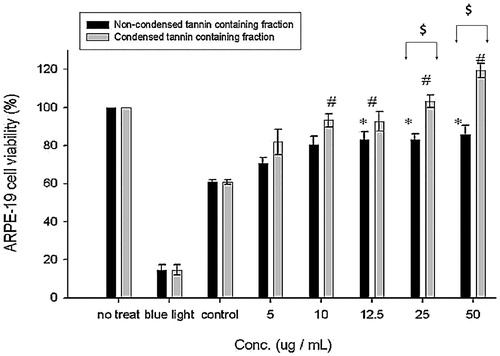
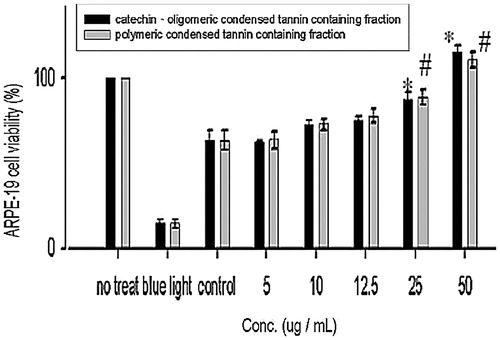
Figure 8. Effect of COCTF and PCTF on the proliferation of ARPE-19 cells. Values were expressed as means ± SD. *Significant different as compared with control for catechin, oligomeric-PA containing fraction (p < 0.05). #Significant different as compared with control for polymeric-PA containing fraction (p < 0.05). *Significant difference between two fractions (p < 0.05).