
Figures & data
Figure 1. Marrubiin, the chemotaxonomic marker of Marrubium genus.
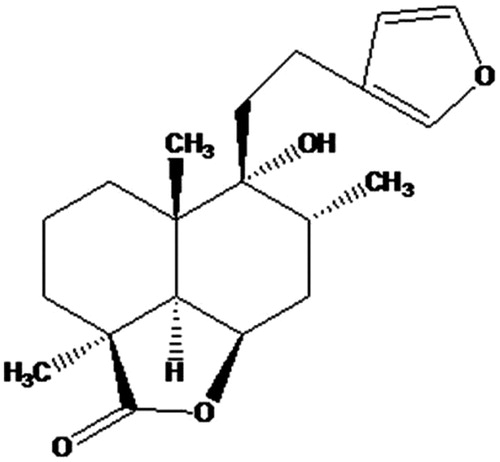
Table 1. Coded levels with actual values of different independent factors.
Figure 2. TLC chromatogram of different extracts of MAE obtained in 16 experiments (2–17) along with pure marrubiin (1) at 254 nm (UV light).
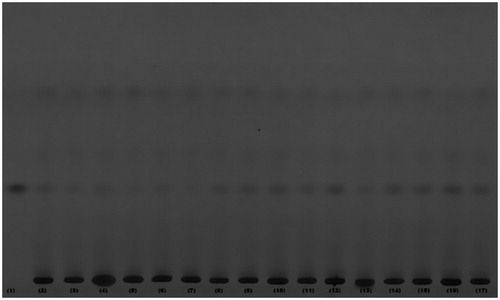
Figure 3. 3 D diagram showing AUC for marrubiin in different extracts of MAE.
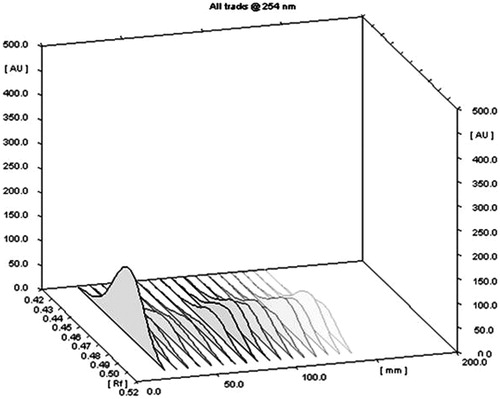
Table 2. % Yield of marrubiin (R) under various experimental conditions as prescribed by CCD.
Table 3. Analysis of variance (ANOVA) for experimental data and estimated coefficient for various variables.
Figure 4. Normal plot of residual between normal % Probability and internally studentized residuals.
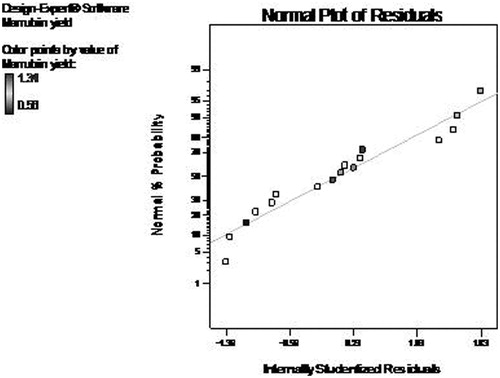
Figure 5. Plot between predicted vs. actual response.
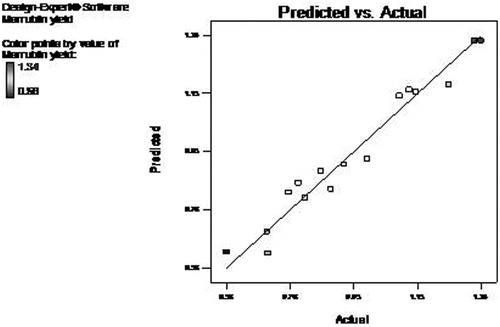
Figure 6. Response surface analysis for % marrubiin yield (R) from Marrubium vulgare L. by microwave assisted extraction with respect to (a) X1 (microwave power) and X2 (irradiation time). (b) X2 (irradiation time) and X3 (solvent to drug ratio). (c) X1 (microwave power) and X3 (solvent to drug ratio).
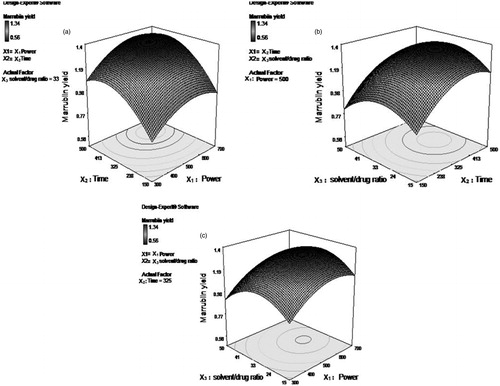
Figure 7. (a). Chromatogram showing AUC for the marrubiin. (b) Chromatogram showing AUC for the conventional extract (SME). (c) Chromatogram showing AUC for the extract obtained by MAE.
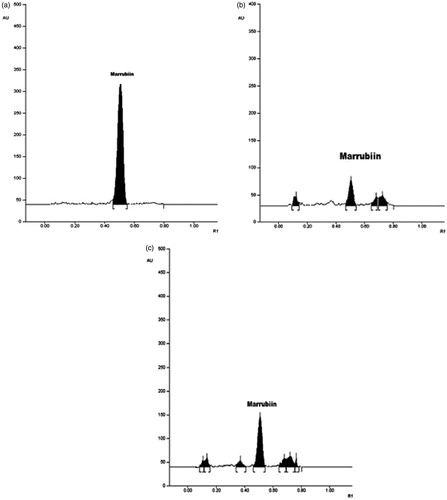
Figure 8. Concentration-based DPPH inhibition (%) of various extracts and ascorbic acid (standard).
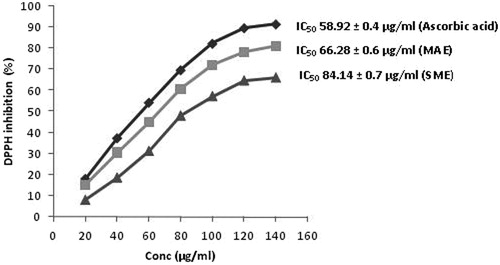
Figure 9. (a) SEM image of drug particles before extraction. (b) SEM image of drug particles after extraction with SME. (c) SEM image of drug particles after extraction by MAE.
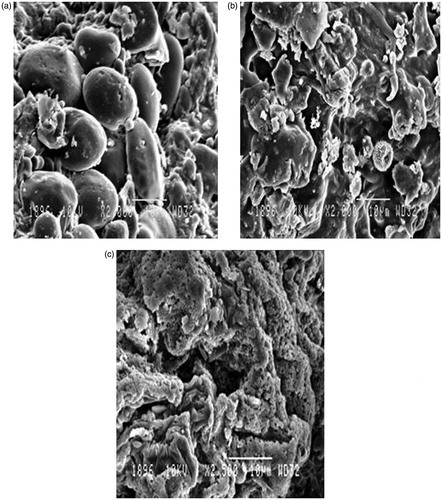
Table 4. Comparison of different extracts for extract yield (%), marrubiin concentration (%), IC50 and CO2 emission.