Figures & data
Table 1. Isoforms tested, marker reactions, incubation conditions and Km used in the inhibition study.
Figure 1. The chemical structure of DHM.
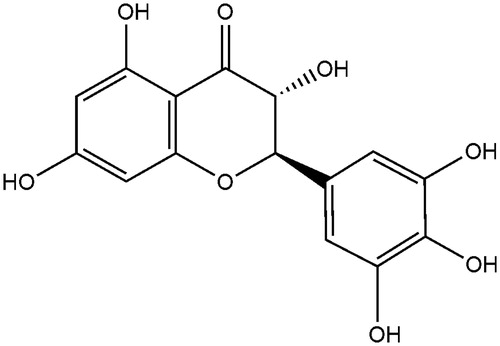
Figure 2. Inhibition of DHM on CYP450 enzymes in pooled HLMs. All data represent mean ± SD of the triplicate incubations. *p < 0.05, significantly different from the negative control. Negative control: incubation systems without DHM; DHM: incubation systems with DHM (100 μM); positive control: incubation systems with their corresponding positive inhibitors (10 μM furafylline for CYP1A2, 1 μM ketoconazole for CYP3A4, 10 μM tranylcypromine for CYP2A6, 50 μM clomethiazole for CYP2E1, 10 μM quinidine for CYP2D6, 10 μM sulphaphenazole for CYP2C9, 50 μM tranylcypromine for CYP2C19, 5 μM montelukast for CYP2C8).
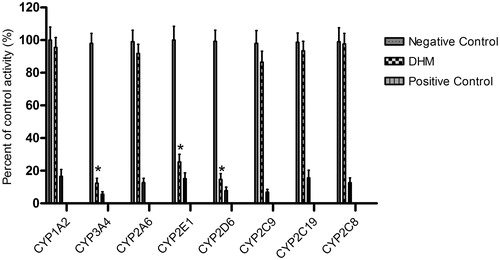
Figure 3. Inhibitory effects of DHM on the activities of CYP3A4, CYP2E1 and CYP2D6.
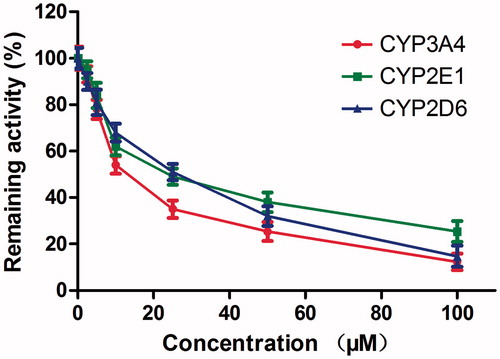
Figure 4. Lineweaver–Burk plots (A) and the secondary plot for Ki (B) of inhibition of DHM on CYP3A4 catalyzed reactions (testosterone 6β-hydroxylation) in pooled HLM. Data are obtained from a 30 min incubation with testosterone (20–100 μM) in the absence or presence of DHM (0–30 μM). The data represent the mean of the incubations (performed in triplicate).
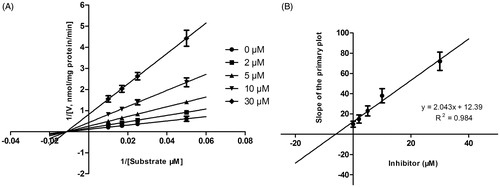
Figure 5. Lineweaver–Burk plots (A) and the secondary plot for Ki (B) of inhibition of DHM on CYP2E1 catalyzed reactions (chlorzoxazone 6-hydroxylation) in pooled HLM. Data are obtained from a 30 min incubation with chlorzoxazone (20–200 μM) in the absence or presence of DHM (0–50 μM). All data represent the mean of the incubations (performed in triplicate).
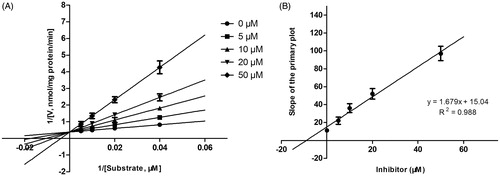
Figure 6. Lineweaver–Burk plots (A) and the secondary plot for Ki (B) of inhibition of DHM on CYP2D6 catalyzed reactions (dextromethorphan O-demethylation) in pooled HLM. Data are obtained from a 30 min incubation with dextromethorphan (5–50 μM) in the absence or presence of DHM (0–50 μM). All data represent the mean of the incubations (performed in triplicate).
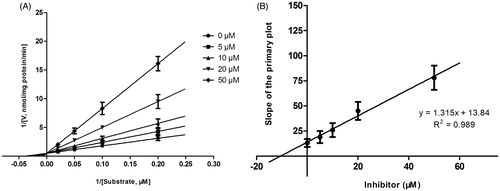
Figure 7. Time-dependent inhibition investigations of CYP3A4, 2E1 and 2D6 catalyzed reactions by DHM (20 μM). All data represent the mean of the incubations (performed in triplicate).
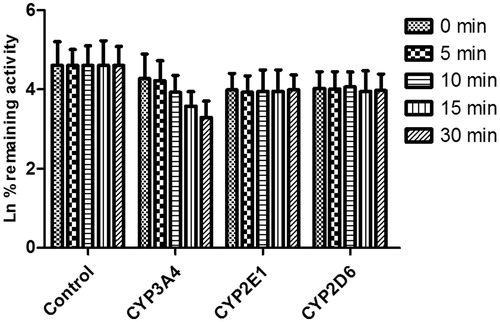
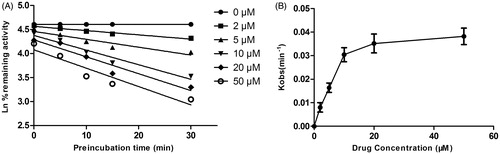
Figure 8. Time (0–30 min) and concentration (0–50 μM)-inactivation of microsomal CYP3A4 activity by DHM in the presence of NADPH. The initial rate constant of inactivation of CYP3A4 by each concentration (Kobs) was determined through linear regression analysis of the natural logarithm of the percentage of remaining activity versus pre-incubation time (A). The KI and Kinact values were determined through non-linear analysis of the Kobs versus the DHM concentration (B).