Figures & data
Figure 1. (A) Percentage inhibition of DPPH scavenging activity exerted by increasing concentrations of PSE and VSE. Data are means ± S.D. of n = 3 distinct determinations. (B) Folin–Ciocalteu assays of total phenolic content. Standard calibration curve obtained with gallic acid (left) and curves obtained with PSE and VSE (right). Data are means ± S.D. of n = 4 distinct determinations. In the right panel, statistical comparison between the two slope coefficients is shown. The phenolic contents of PSE and VSE expressed as GAE are reported in . (C) Assays of total flavonoids. Standard calibration curve obtained with quercetin (left) and curves obtained with PSE and VSE (right). Data and statistics as above. The flavonoid contents of PSE and VSE expressed as quercetin equivalents are reported in .
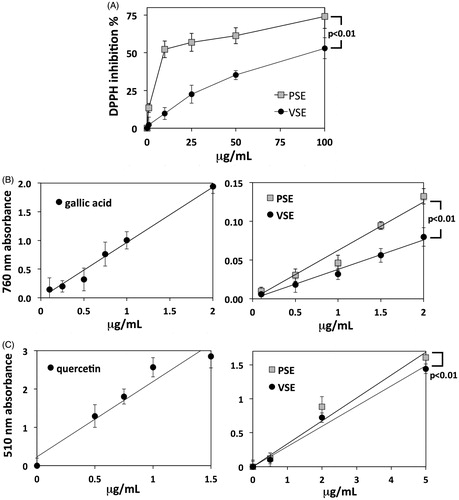
Table 1. Quantification of total phenolics and flavonoids in sulla extracts.
Figure 2. MS/MS spectrum of quercetin-3-O-β-glucopyranoside-7-O-α-rhamnofuranoside. The hypothesized fragments and their m/z ratios are indicated with the broken line in the structure.
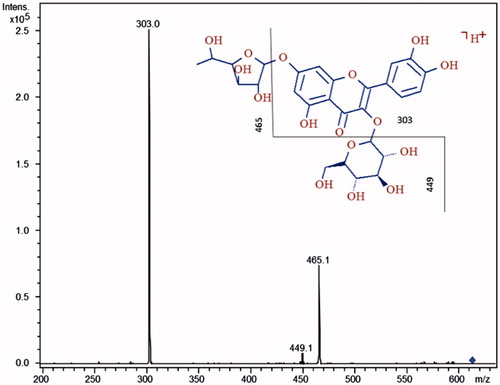
Table 2. LC-MS identification of major compounds in PSE and VSE extracts.
Table 3. LC-MS relative quantification of major flavonoids from PSE and VSE.
Figure 3. (A) Percent inhibition of Clostridium histolyticum collagenase activity exerted by PSE and VSE, determined by in vitro assay and expressed as means ± S.E.M (n = 3). (B) Percent inhibition of elastase from porcine pancreas by PSE and VSE. Data as above. (C) Induction of fibroblast collagen production by PSE and VSE, determined by ELISA after 48 h incubations. Data are expressed as means ± S.D (n = 6).
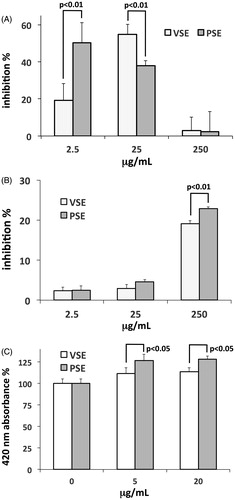
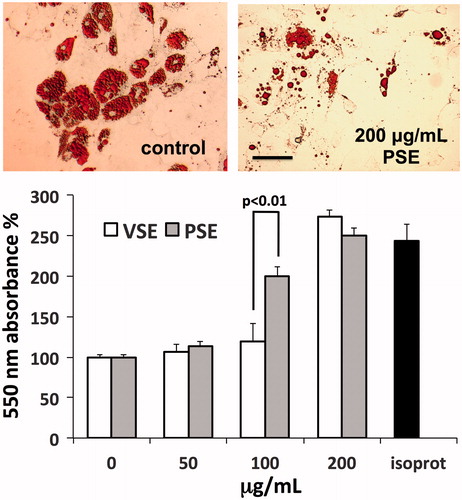
Figure 4. Induction of lipolysis in human adipocytes by PSE and VSE. Upper panel: microscope views of adipocytes exposed or not to PSE, fixed with FineFix®, stained with Oil Red O and then photographed under an Olympus IX71 inverted microscope. Bar =100 μm. Lower panel: assay of glycerol released from adipocytes after exposure for 3 h to extracts or to 1 μM isoproterenol (isoprot) as positive control. Data are standardized as percent of control and expressed as means ± S.D (n = 6).